
The Knee-Jerk Reaction
Among the many different types of engagements we work on, we’re often called in to help large organizations “set the ship straight.”
This sometimes happens after the client goes live on a new marketing platform or solution — sometimes even years after they go live — when the client realizes they’re facing increasing user dissatisfaction with the platform and/or solution, and mounting adoption challenges.
When we begin this sort of engagement, one of the first things we do is measure user sentiment. Typically the results aren’t surprising — but they’re certainly disheartening. For example, consider this survey question:
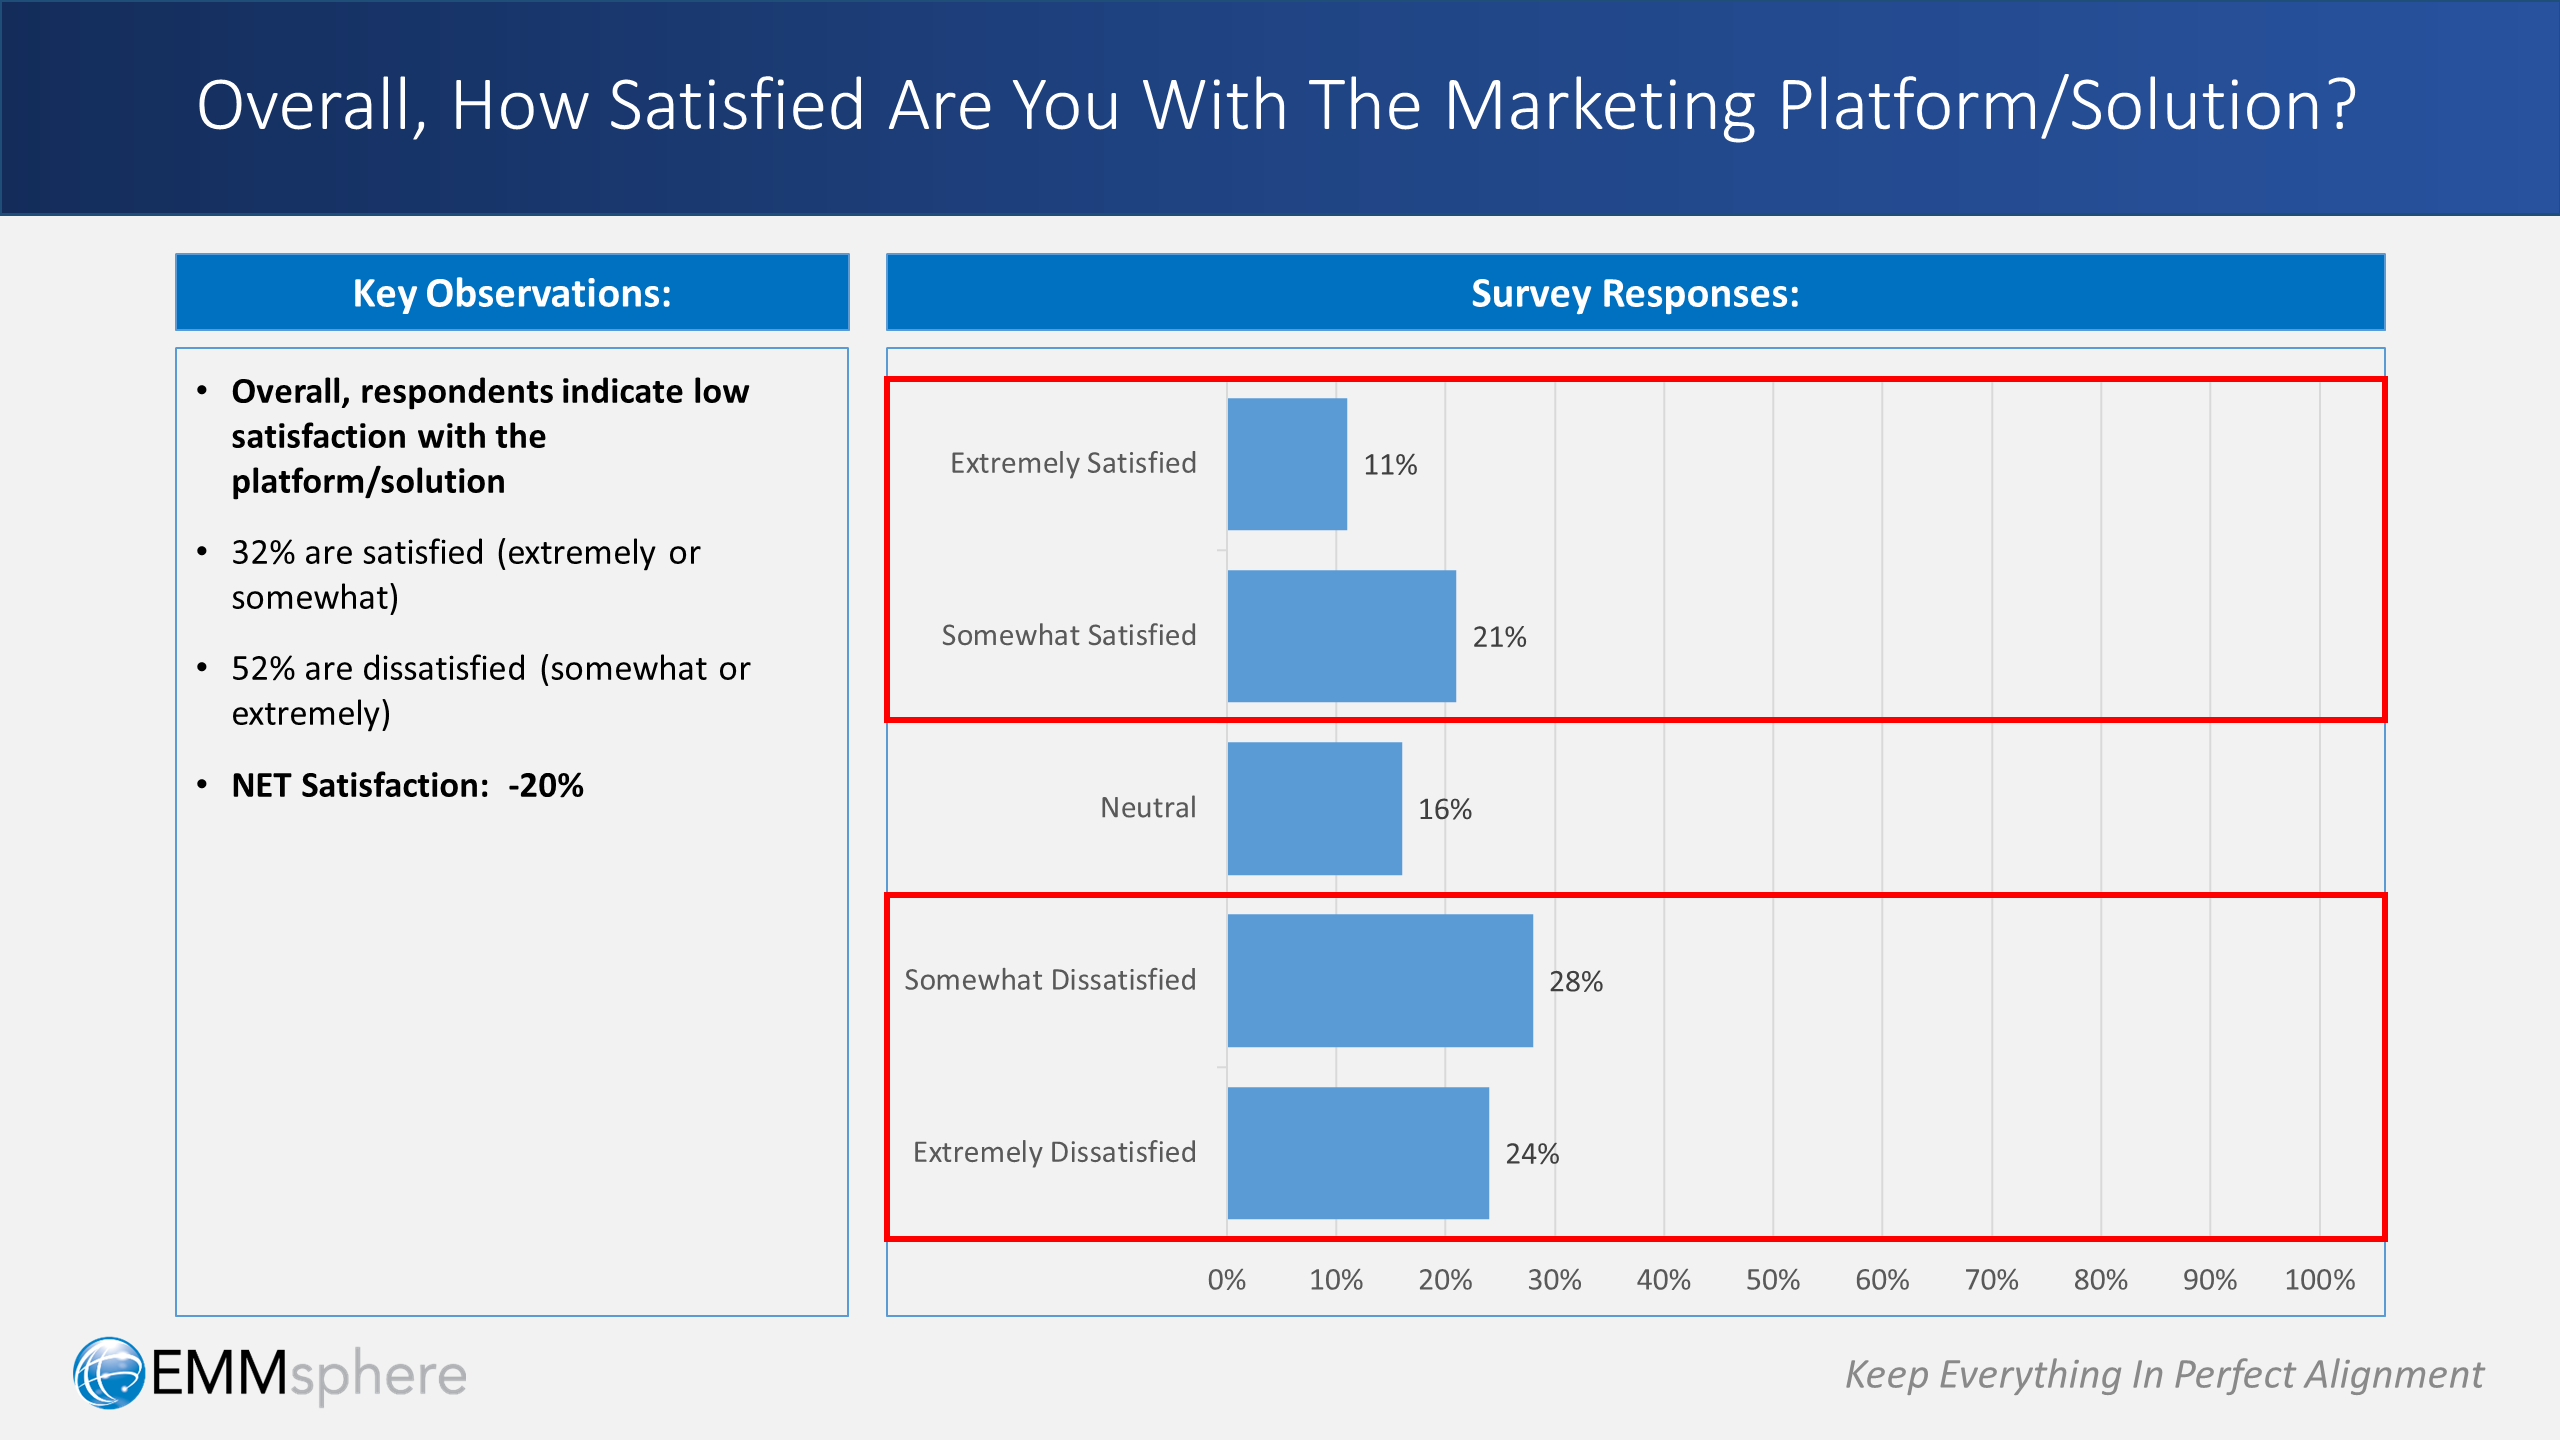
The data clearly shows things aren’t going well. In this case, net user satisfaction is at -20% — yes, that’s minus 20. Users are unhappy, sentiment is alarmingly low (and probably headed lower), and the going-in enthusiasm once present at the start of the deployment is all but gone.
Understandably, when faced with this kind of sobering data, the client’s knee-jerk reaction is often draconian: let’s throw the software out.
But wait!
There’s one very encouraging fact to consider at a time like this: more often than not, “throwing it out” is actually not the right conclusion once the facts are carefully analyzed. Which is very good news, because it usually isn’t the most politically expedient either.
So let’s dig deeper to find out what’s really happening here: what is the underlying cause?
From Challenges to Cause (Part 1)
To pinpoint underlying factors that might be causing the lack of user satisfaction, we typically expand our analysis with qualitative information. Meaning, we interview users, both individually and in groups, to hear them express the issues they’re experiencing with the platform and/or solution.
Almost invariably, we find there’s a clear distinction between what users are experiencing — and what’s actually causing that experience.
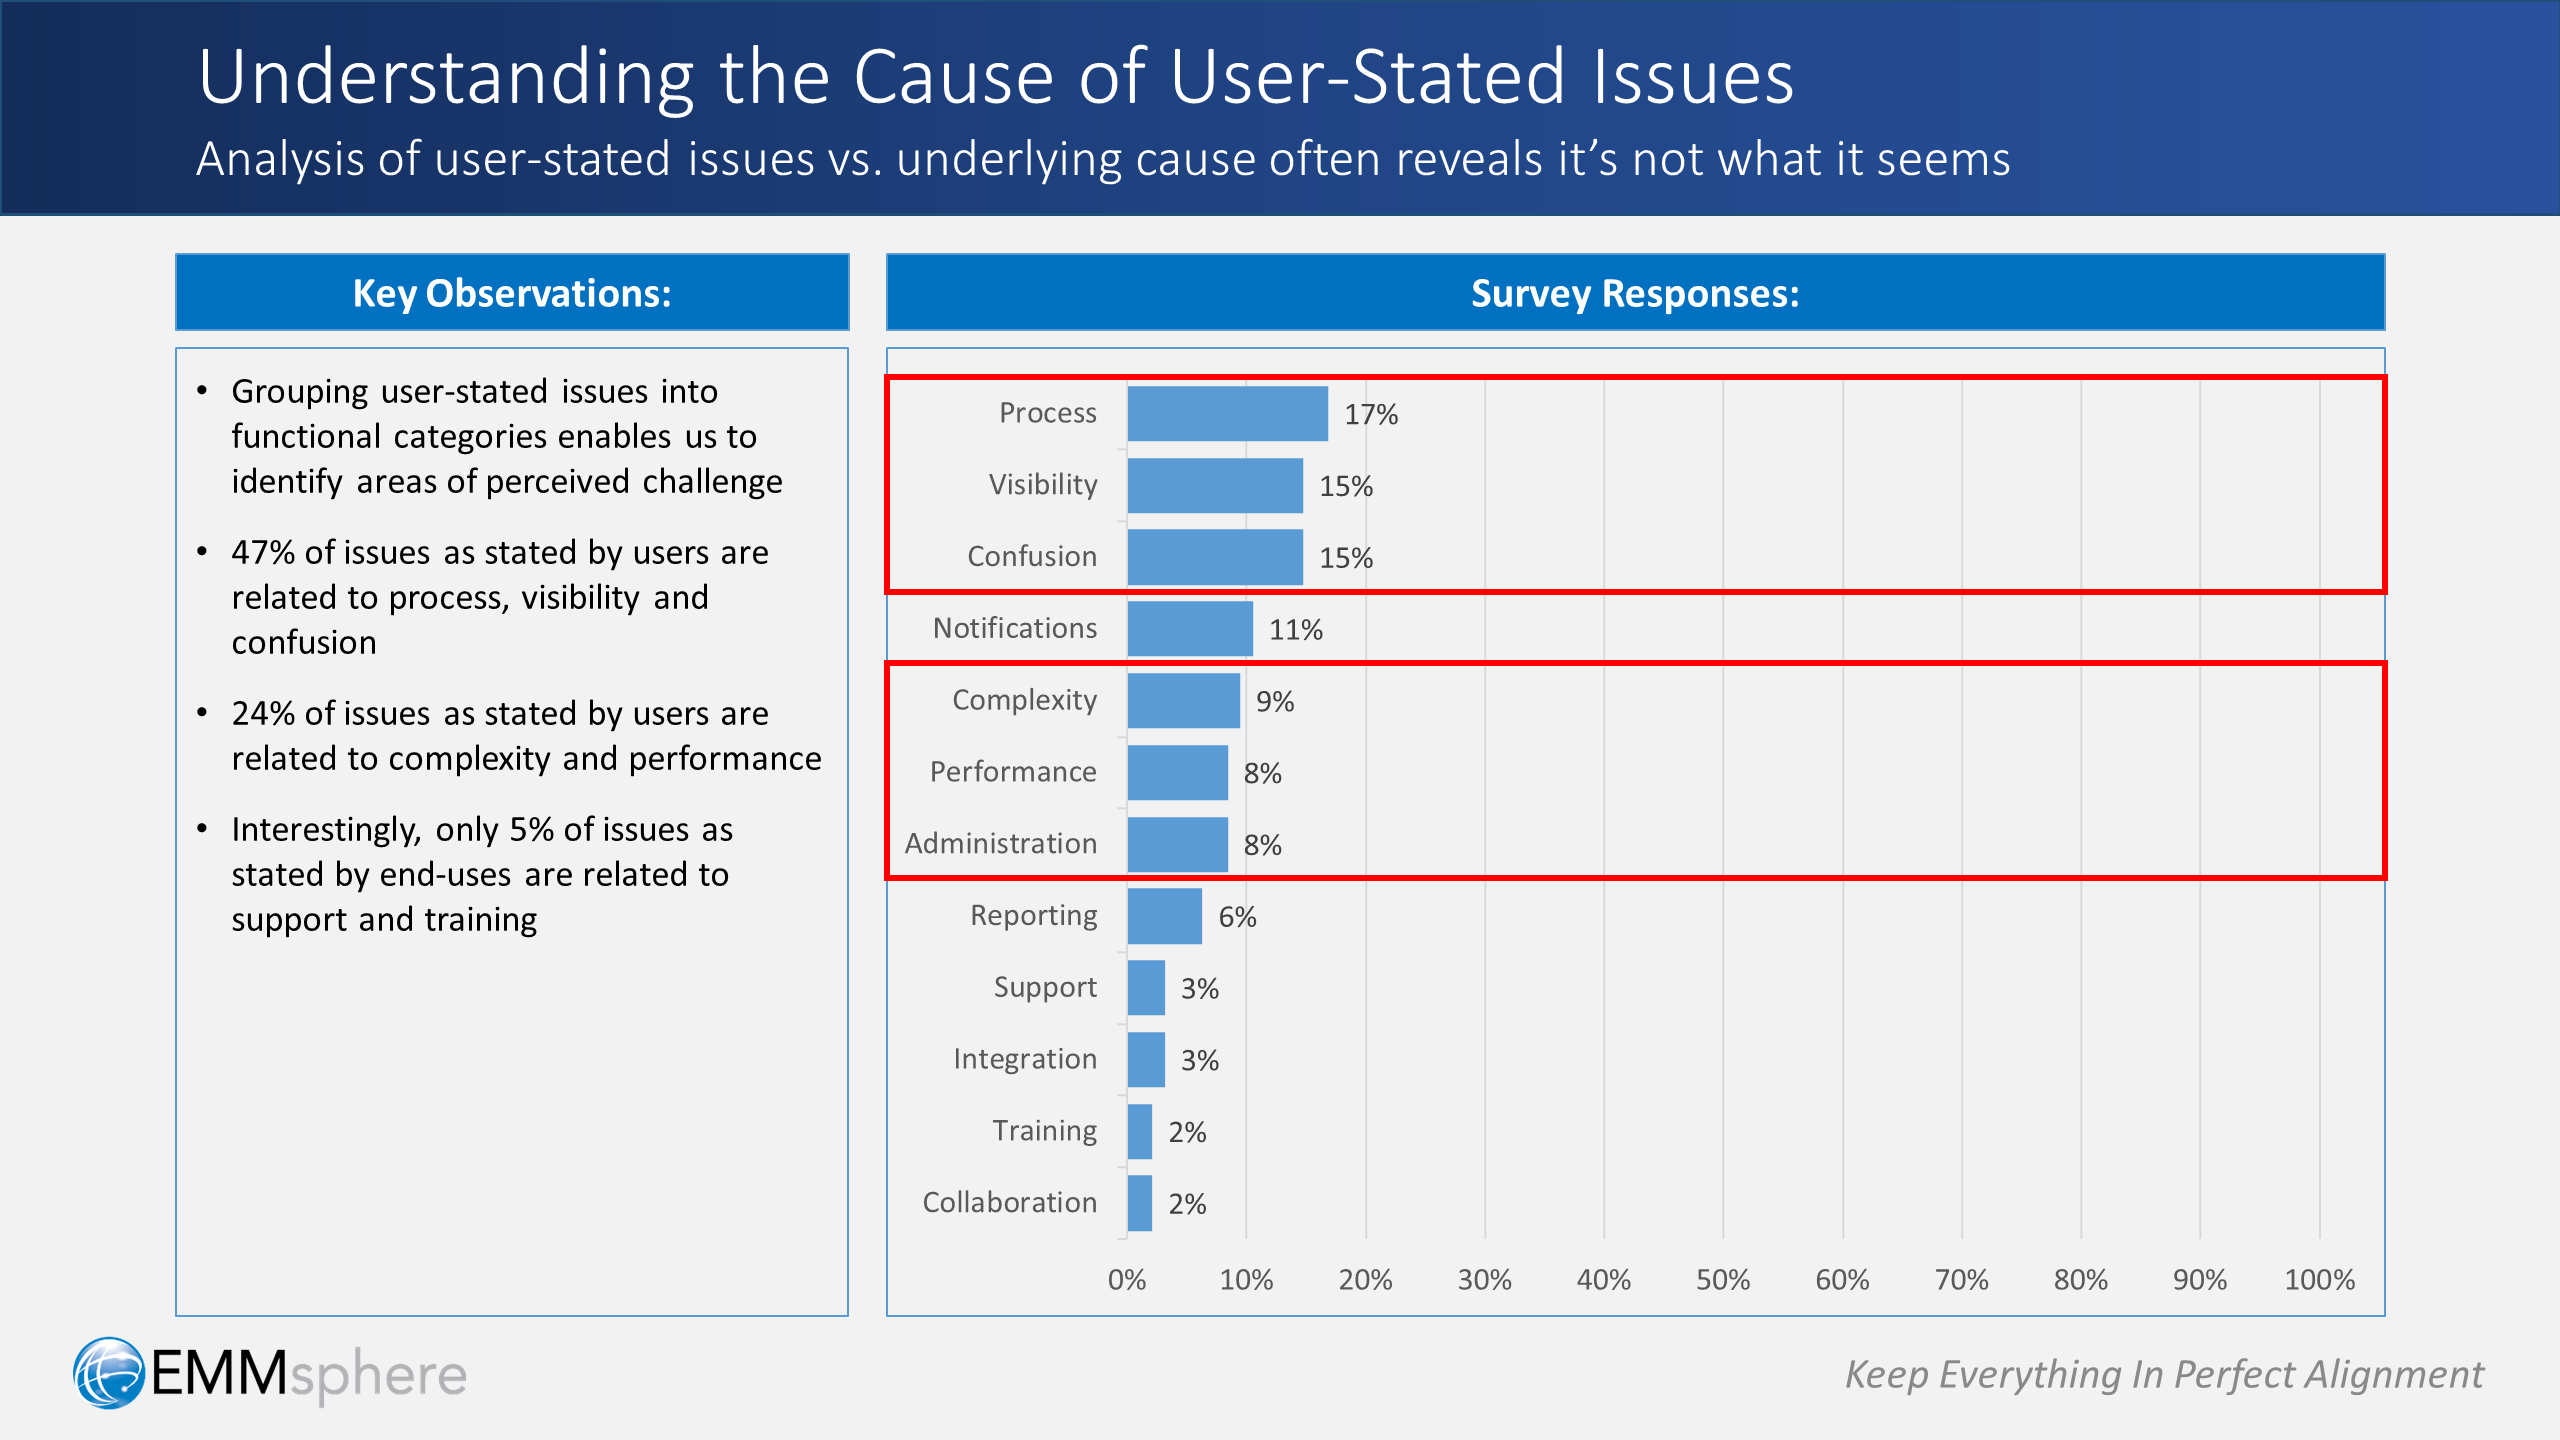
To illustrate this point, consider the example shown above.
When we categorize issues as reported by end-users into functional buckets, specific areas of challenge become apparent. In this case:
- 47% of user-reported issues are related to process, visibility and confusion.
- 25% are related to complexity, performance and administration.
- Only 5% of users indicate that their issues are related to support and training.
From Challenges to Cause (Part 2)
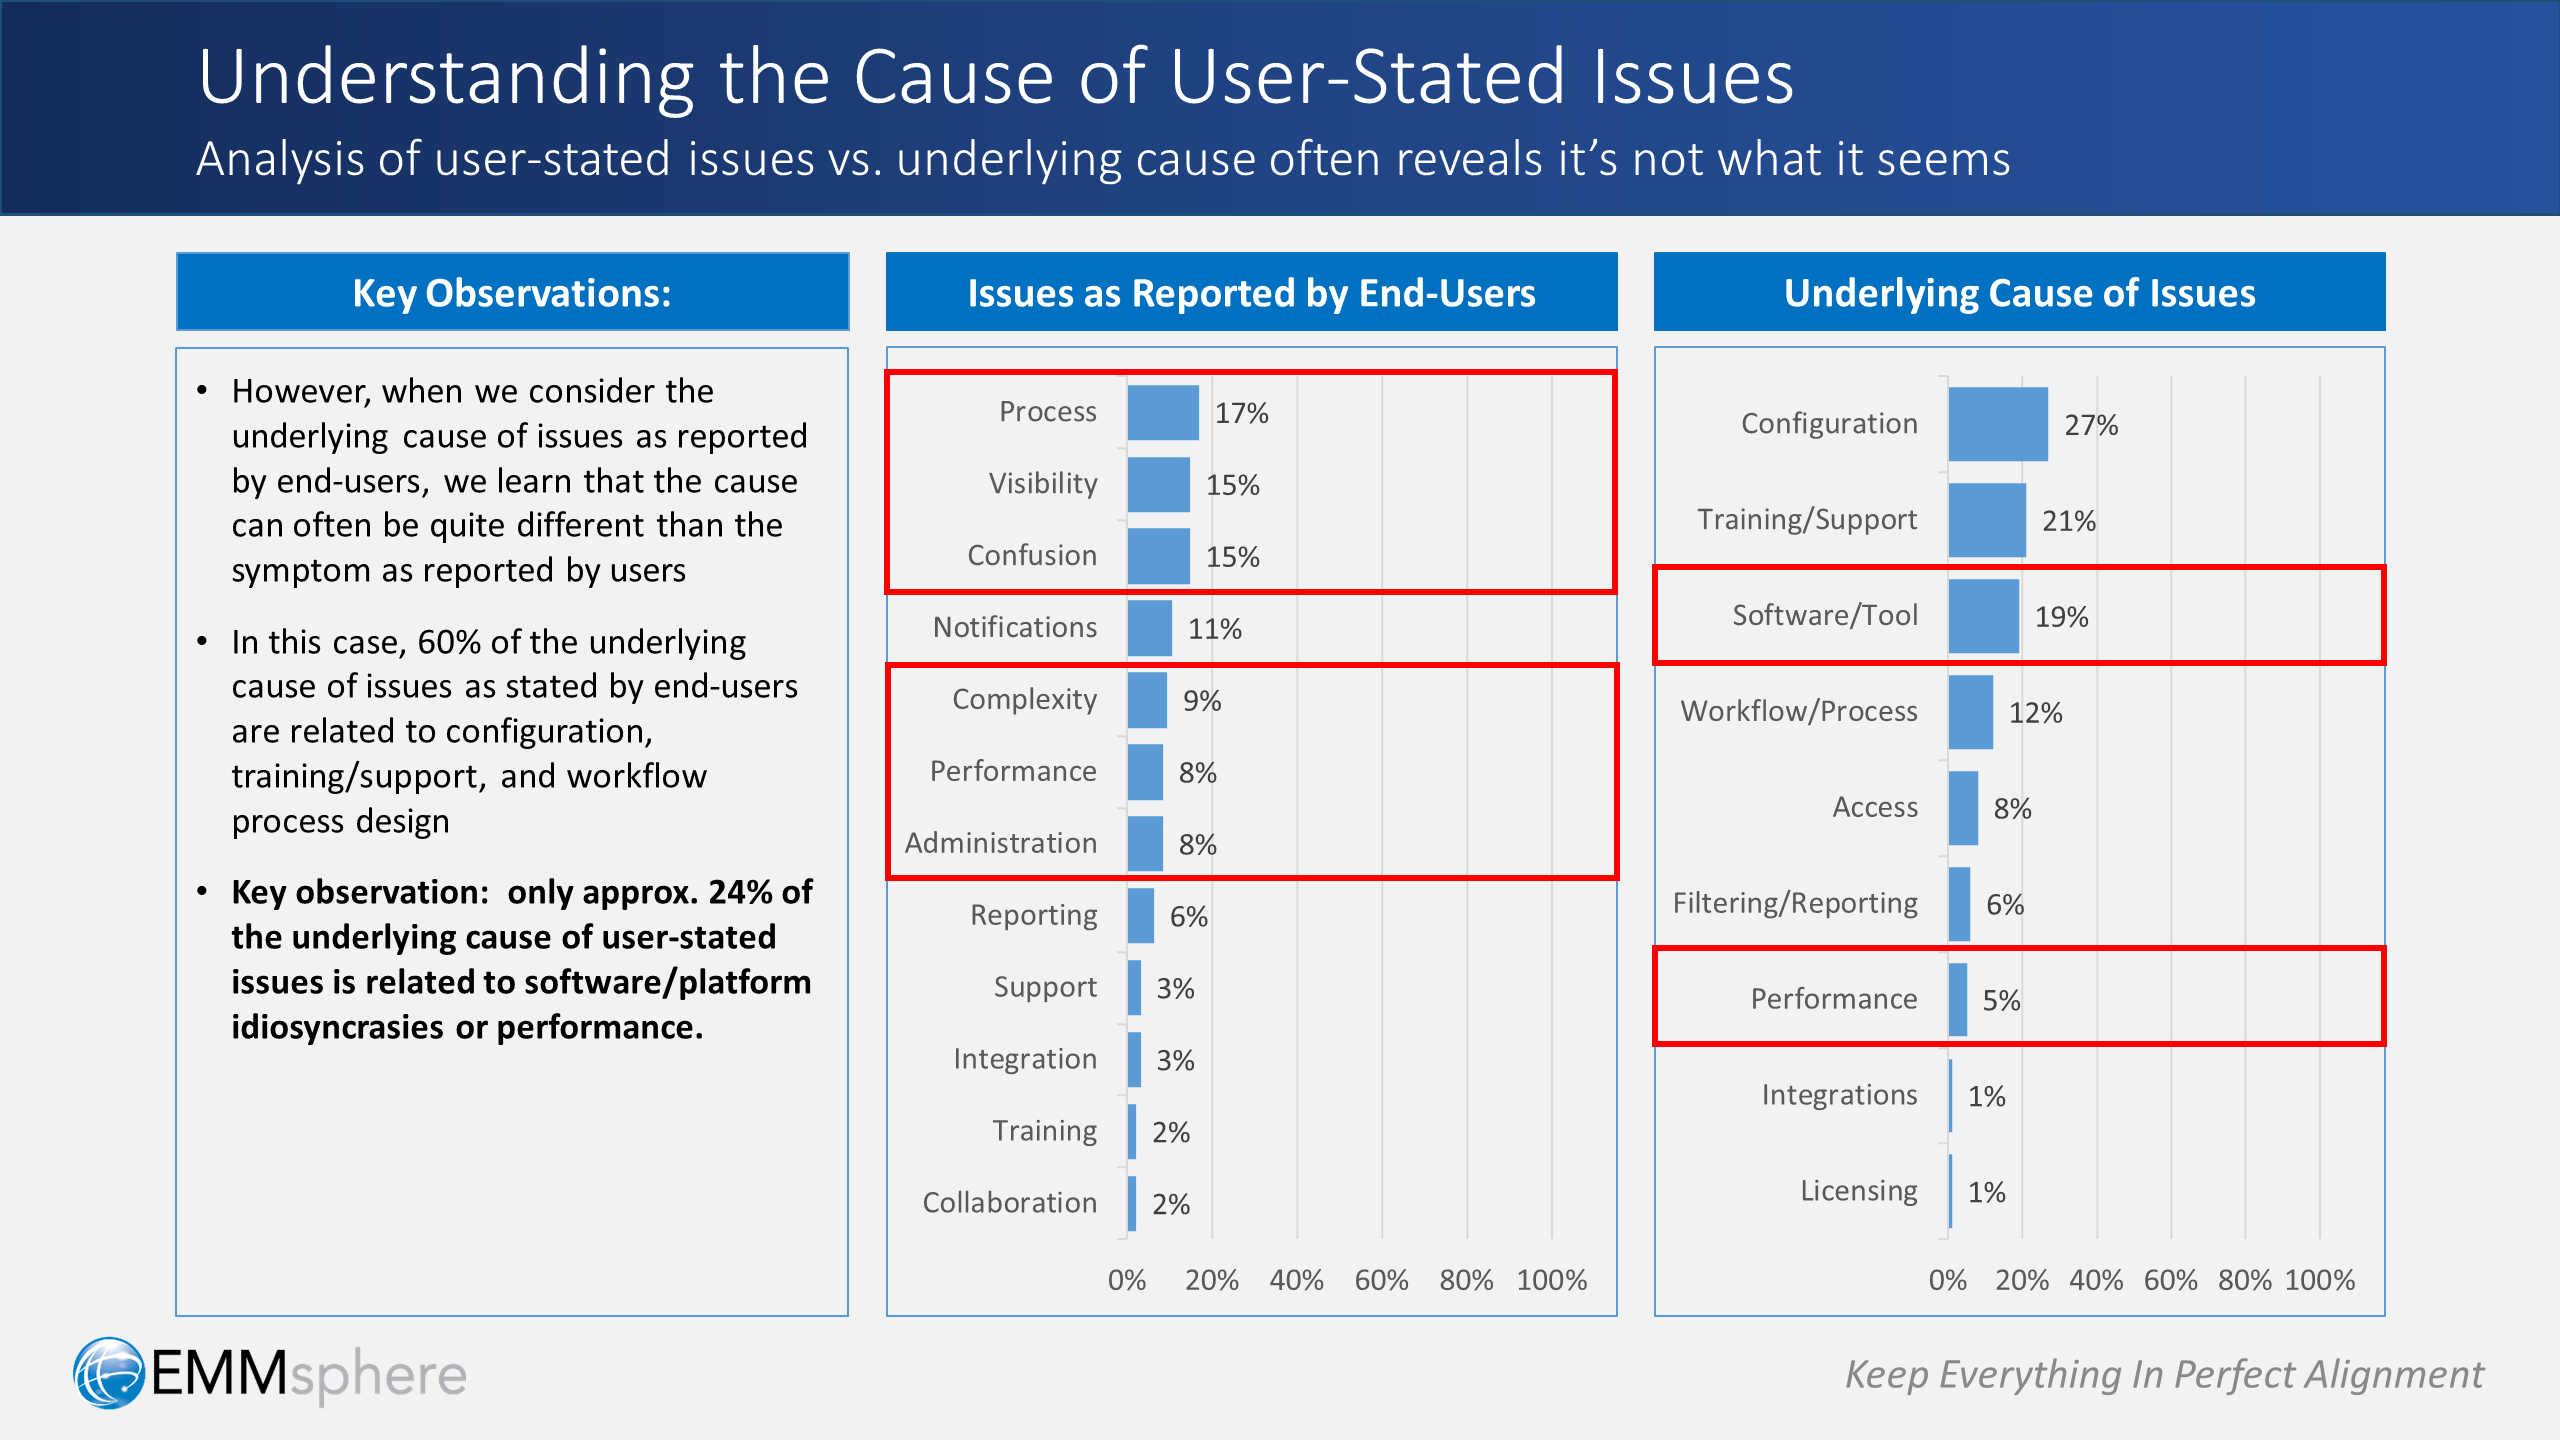
However, if we further categorize those same user-stated issues into cause-related buckets, then the true nature of underlying cause begins to emerge:
- 60% of the challenges noted by end-users are actually caused by issues related to solution configuration, training, and workflow/process design
- Only 24% of the underlying cause of user-stated issues is related to inherent platform/software characteristics, idiosyncrasies, constraints, or performance
Now we’re on the right path!
And, much to the relief of the client, we’ve shown that the underlying cause of their problems is not the platform or the software. It’s really about other issues — issues that they can influence and control.
From Cause to Priorities
So the question now becomes: how can we improve on all of this?
Once again, we rely on input from our users, and we conduct more qualitative analysis. We ask users explicitly: “what are your top 3 recommended areas for improvement?”
Defining Improvement Categories
The first step is to look at all of the open-ended user recommendations as a whole, and based on that holistic view, define a comprehensive set of improvement categories, and then assign each recommendation to a corresponding category.
Of course, each situation is different, but we’ve found that there’s typically a core set of improvement categories that come into play. We’ve also found that with minor adjustments, that core set tends to cover most client situations.
These categories, which are used in the example above, are defined as follows:
- Process design: improving the overall sequence and configuration of tasks as defined in workflow templates on the platform, and closely aligning those templates to capture the essence of corresponding business, marketing, and operational processes
- Process streamlining: reducing the redundancy or undue complexity of workflow templates configured on the platform, e.g. eliminating overly complex branching logic or repetitive tasks
- Project & task management: leveraging features and capabilities offered by the platform and/or the configured solution that help users with project and task management-related activities
- Flexibility: the ability for users to dynamically adjust solution capabilities and/or process templates to accommodate unforeseen scenarios or unusual cases
- Consolidation & breadth: the functional coverage of the platform/solution in terms of the proportion of user’s required processes or capabilities that are incorporated into the solution (as opposed to being delivered by other solutions)
- Document management: the uploading, versioning and management of project-related documents and materials on the platform or solution
- Document review: capabilities surrounding online review & approval of documents/materials
- Visibility & reporting: the definition, display and distribution of data listings, views and reports
- Integration: connections, both one-way and two-way, to other systems to enable consolidated views of related data
- Solution configuration & support: capture of enhancement requests, feedback, and issues submitted by users and how these are prioritized, scheduled and implemented
- Notifications & alerts: time-sensitive delivery of event-driven messages to affected users regarding information activity or status
- Ease of use & UX: the presentation of information to users and their visual, navigational and interactive experience on the platform
- User training & support: the availability and delivery of learning materials, onboarding and training classes regarding solution capabilities, roles, responsibilities and expectations
Calculating Improvement Priorities
The next step is to calculate the weighted value of each improvement category based on the recommendations collected from users.
Each user’s top 3 recommendations (which are now assigned to improvement categories as noted earlier) is assigned a point value: 3 for the 1st priority, 2 for the 2nd priority, and 1 for the 3rd priority. When we sum across all recommendations (and assigned categories), and present each improvement category as a percentage of the total, we can clearly see where we need to focus our efforts going forward.
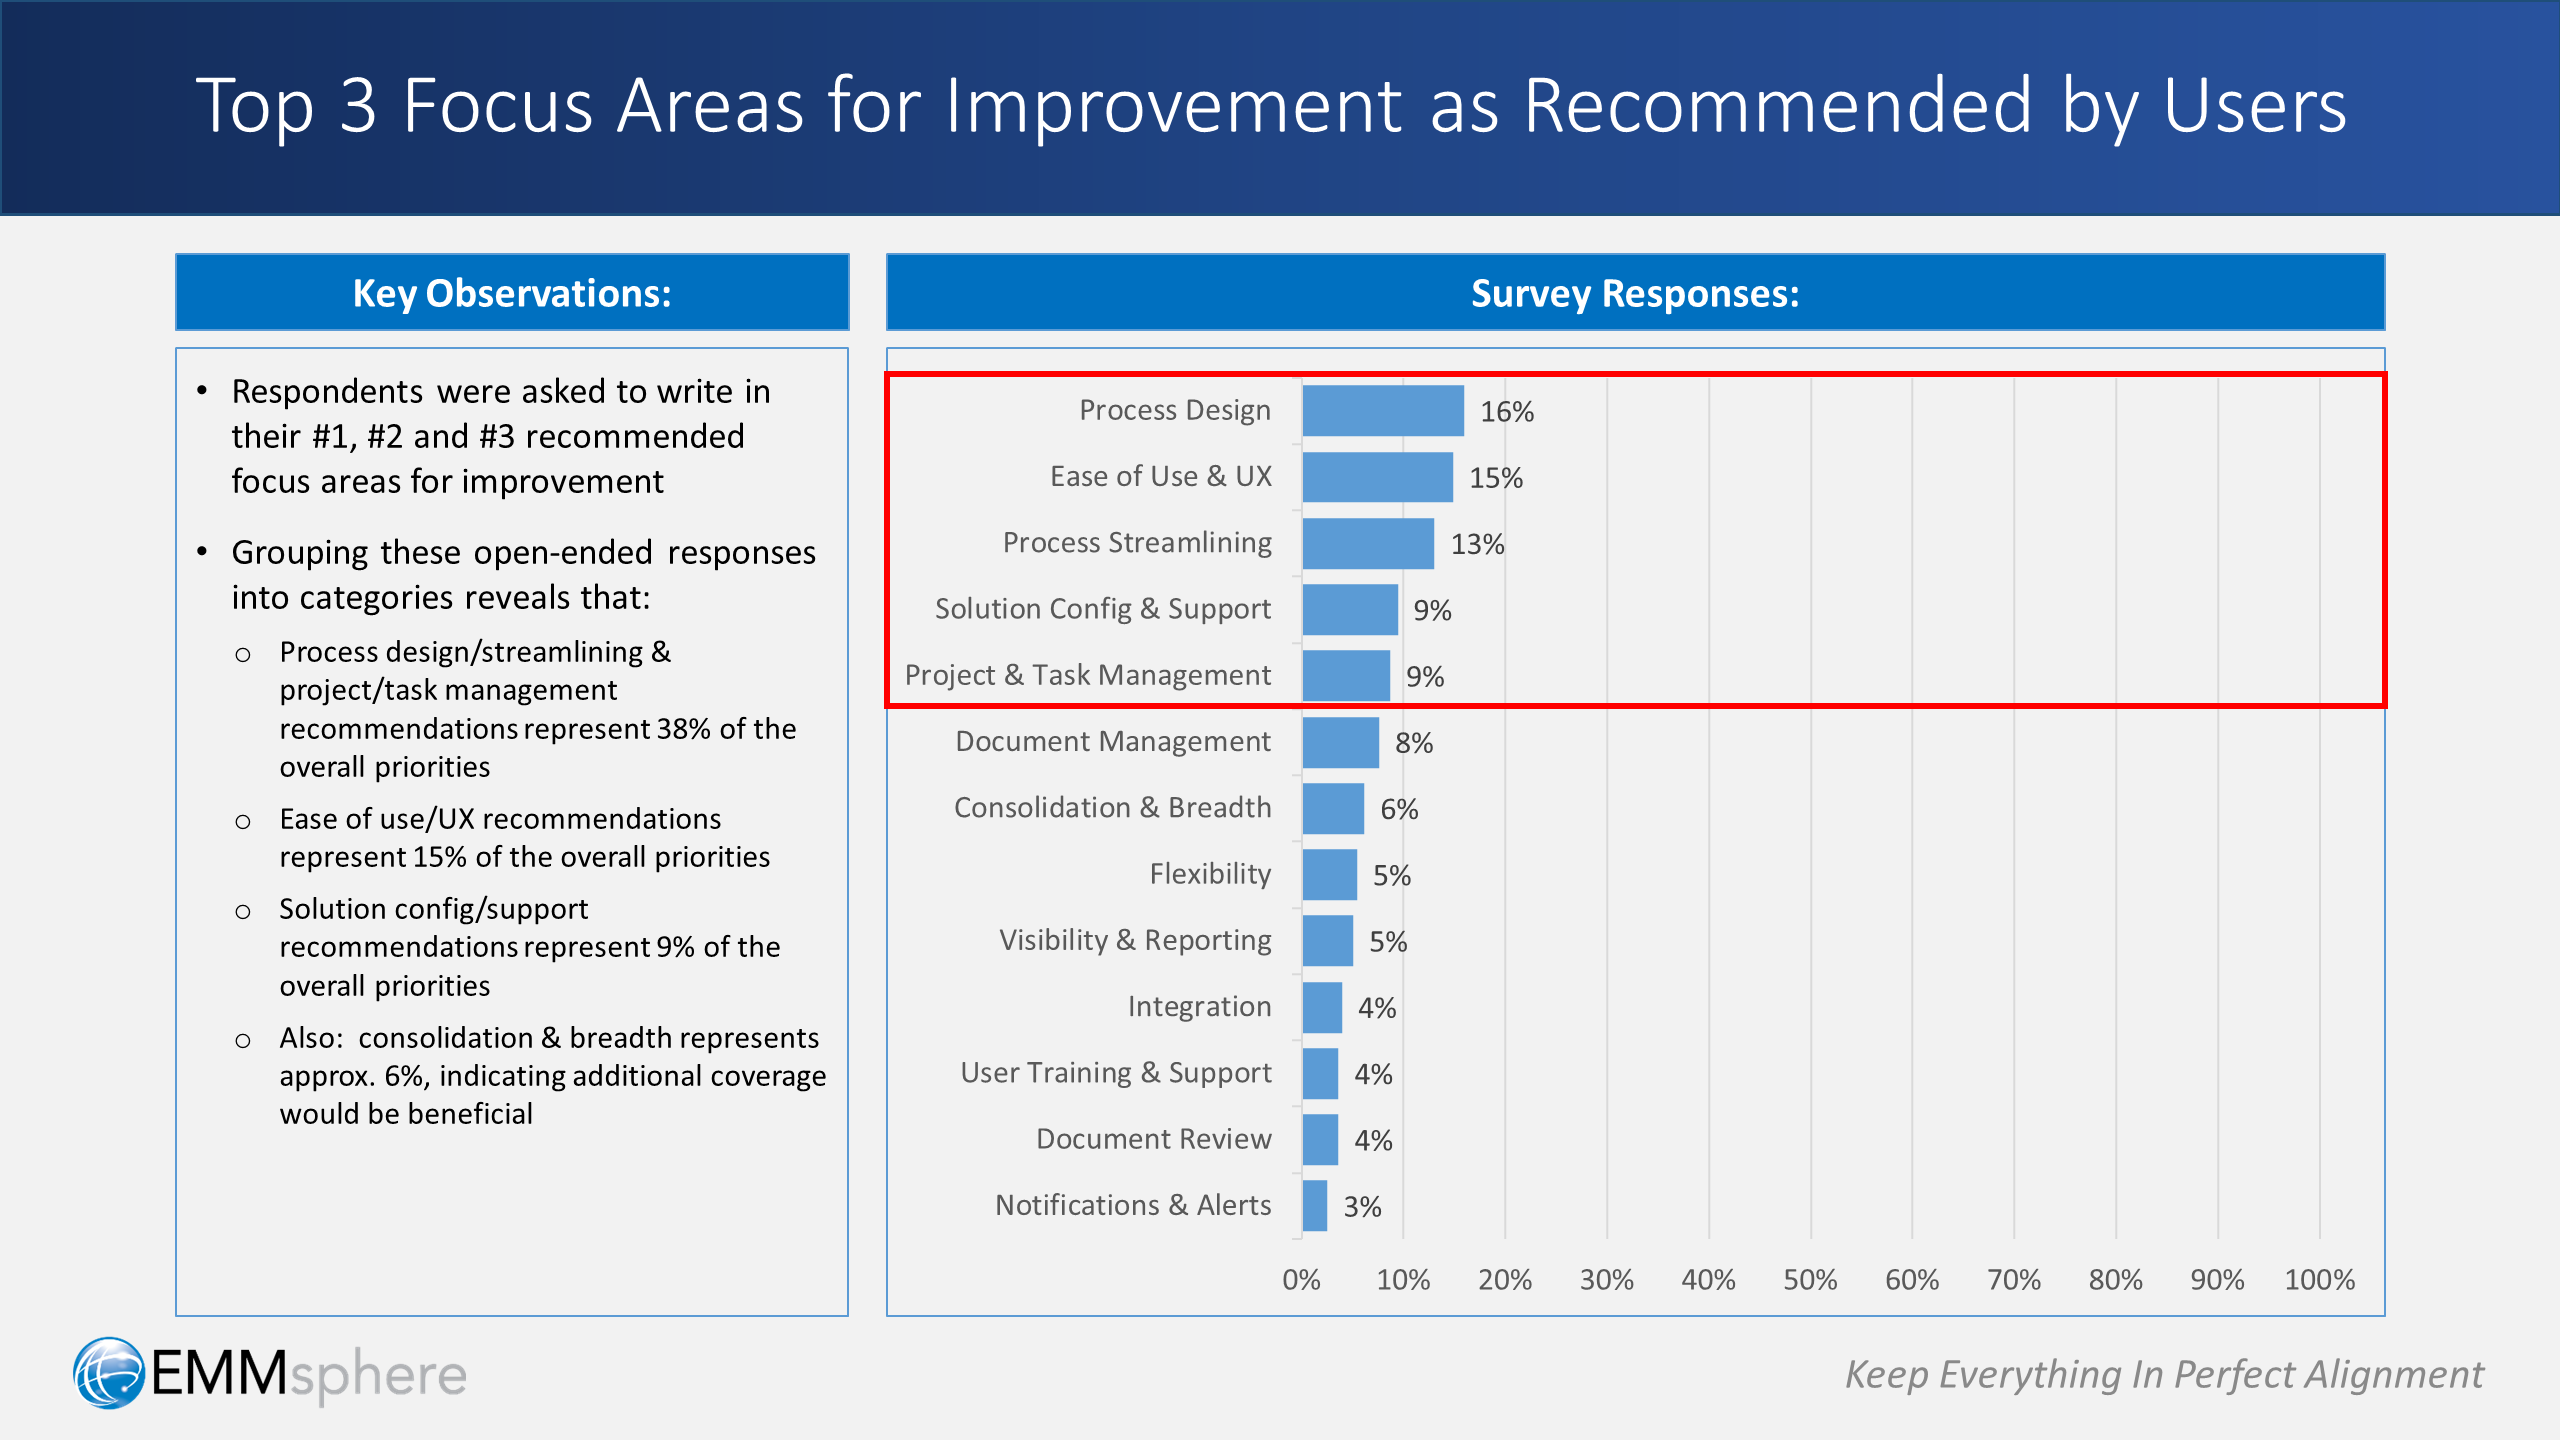
As shown in the example above:
- 38% of the overall priorities encompass process design, process streamlining, and project/task management
- 15% of the overall priorities are surrounding ease of use and UX improvements
- 9% of the overall priorities are regarding solution configuration & support
As an extra point worth mentioning: note that consolidation & breadth represents approximately 6% of the overall improvement priorities. This suggests that providing additional coverage of business and/or marketing processes will also help, especially when taken alongside the process design and streamlining priorities noted above.
From Priorities to Action
So far, we’ve gained a deeper understanding of what’s actually causing the lack of user satisfaction. We’ve also been able to pinpoint and prioritize key areas for improvement going forward.
But even better, we’ve discovered that these high-priority areas for improvement often are not constrained by platform or software-related limitations. In other words:
So, how about if we take advantage of our newfound powers? Let’s push forward toward tangible improvements — let’s put together an action plan!
Specifically, we define a series of high-impact steps that can be scheduled, assigned and executed in a collaborative manner with client team members. At a high level, here’s what our high-impact action plan might look like:
Step 1: Business Process Validation
Deploy a cross-functional and collaborative team to review and validate the key business processes that are (or will be) slated for implementation and management on-platform.
Output: business process validation assessment
Step 2: Solution Workflow Alignment, Design & User Experience Diagnostic
Deploy a cross-functional and collaborative team focused on the overall alignment of business processes, solution workflow design and user experience to analyze and evaluate solution workflows within context of the business processes they support, and to identify workflow enhancement ideas.
Output: solution workflow, process alignment & user experience optimization plan
Step 3: Workflow & User Experience Design Optimization & Realignment
Deploy a cross-functional and collaborative workflow optimization team to execute recommendations from the workflow & UX optimization plan (indicated above).
Output: realigned library of solution workflow templates & recalibrated user experience
Step 4: Enhancement Request & Support Prioritization & Activation
Review outstanding solution enhancement/support tickets and prioritize and/or streamline for fast-track implementation within context of the workflow & user experience optimization plan (indicated above). Also enhance and re-release the support process to incorporate user enhancement ideas.
Output: prioritized list of enhancement items & enhanced request submission process
Step 5: Training with Business Process, Case, and Problem-Solving Labs
Deploy a collaborative training team to itemize & develop business process, business case and problem-solving-oriented training materials, and set up hands-on labs for user learning.
Output: business case learning materials & learning lab deployment
Step 6: Change Management & Communication Program
Set up and institutionalize a formal organizational change management board with representation across groups, a roster of activities & responsibilities, and a defined cadence of sentiment measurement checkpoints. Also formalize a 2-way communication initiative to periodically distribute solution-related information, and to periodically collect feedback and enhancement ideas.
Output: organizational change management program with 2-way communication feedback loop
Closing Thoughts
As they say, things aren’t always what they seem. And in our world of marketing technology platforms and solutions, that is certainly the case.
An enormous amount of effort and investment goes into the selection, deployment and support of enterprise-class marketing technology. The stakes are very high. So when things aren’t going well, our advice is always to withhold judgement — and knee-jerk reaction — until everyone has clarity on underlying cause.
In short: go beyond the surface and spend the time and effort to dig deeper into the symptoms. Relentlessly ask why. And, always — always — solicit a lot of input and suggestions from users.
Because when you engage in meaningful and sincere dialog — and when you listen closely — you’ll likely discover ways to dramatically improve user satisfaction. In fact:
Leave a Reply