
Introducing Our Cost-Justification & Impact Model
Of all the areas of consideration that go into a platform decision, estimating the economic impact may be the most difficult part, because it typically receives the most scrutiny: your CMO will need it in order to build a compelling case, and your CFO will second-guess any assumptions you make.
We’ve experienced that scrutiny first-hand many times, since we’ve helped many organizations develop their cost justification analysis as they prepared for executive-level approval. Taking all of that experience into account, we developed an extensive impact model, which has become an invaluable tool that we’ve used successfully at least a dozen times over the past decade.
So, in this post we’ll describe our impact model. We sincerely believe that by employing our innovative approach, you’ll be able to calculate the economic impact of a switch and identify the key drivers of that impact.
Exactly the kind of thing that should make your CMO happy, and your CFO confident, in your conclusions.
The Cost of a Switch
The conversation around impact usually begins with cost.
And, as you pull together the various line items of cost around a new platform, it’s not unusual to discover that the cost of a switch may be 1.5 to 3 times that of the current solution.
After all, a switch will entail additional software licenses, an extensive effort to redesign processes, configuration costs, plus setup and training that otherwise would not be necessary. None of which would be necessary if you decided to stay on your current platform — these costs are in effect all incremental.
But here’s the key thing to remember about estimating impact:
And in fact, as we’ll show in this post, the impact of productivity gains under a switch can vastly outweigh additional costs such as those mentioned above.
Calculating the Economic Impact of a Switch
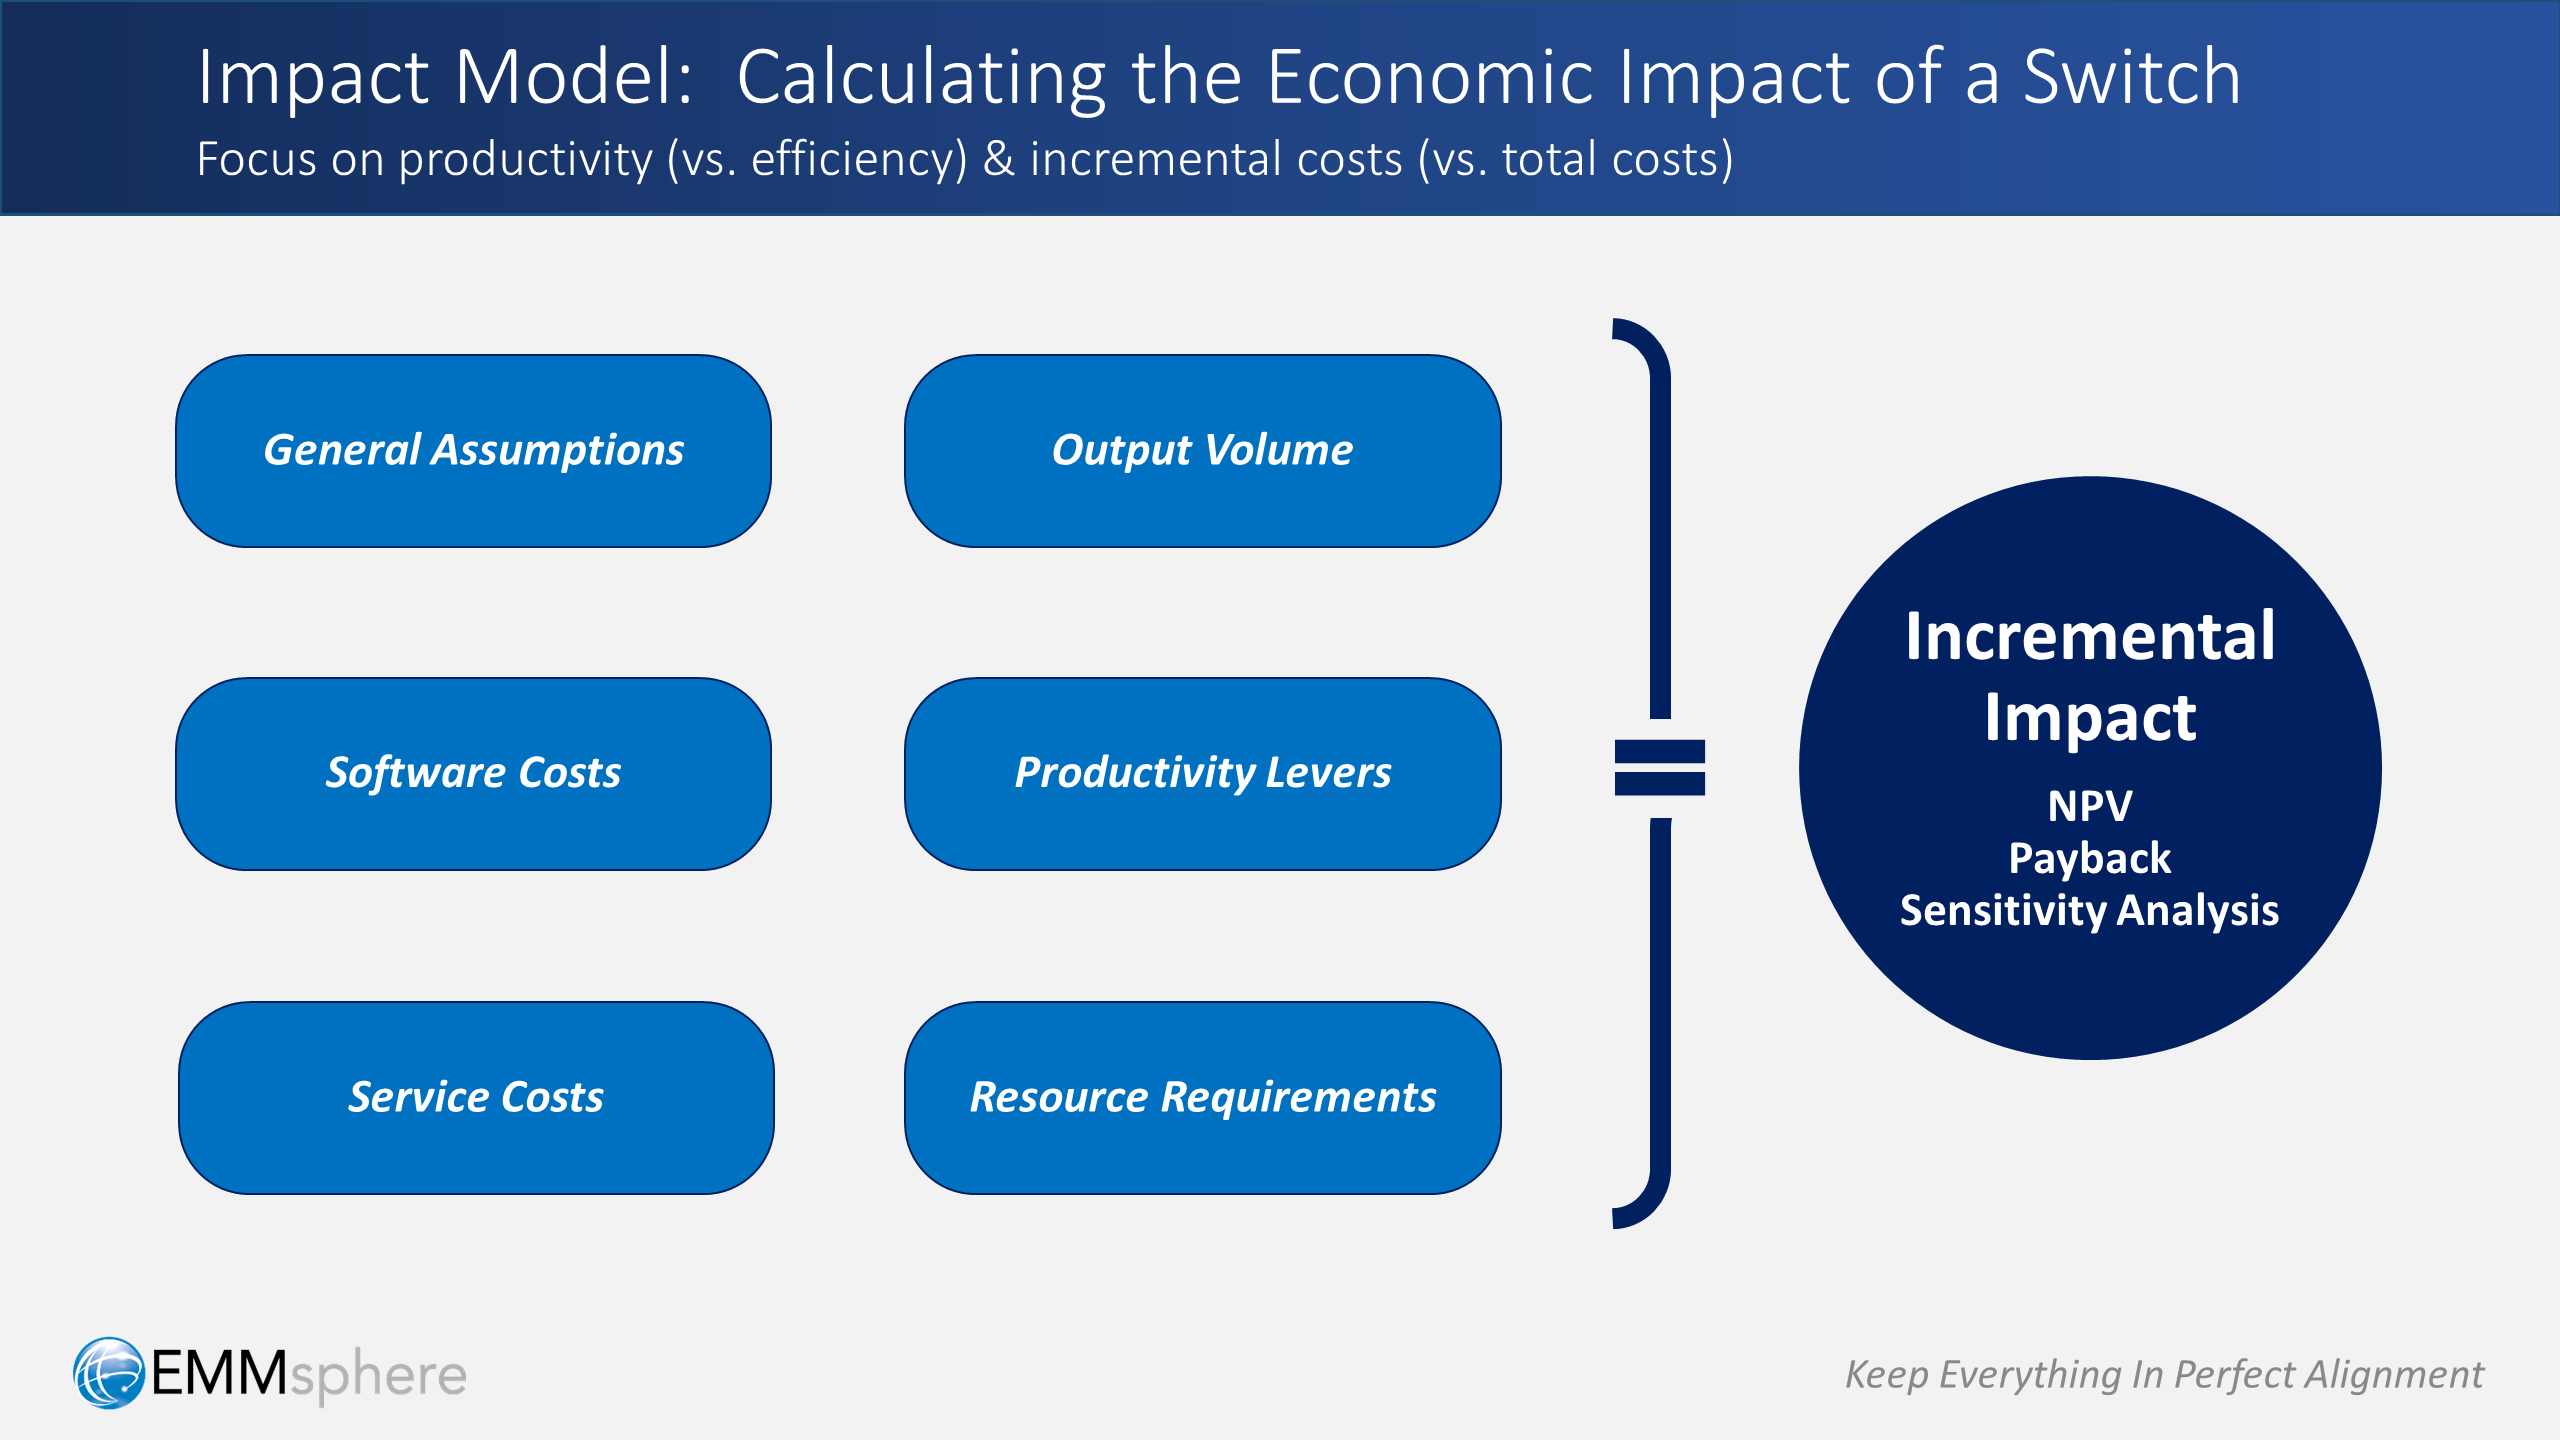
To illustrate the point that it’s not about cost — that it’s really about productivity — let’s walk through our impact model step by step:
- First, we’ll talk about general assumptions and input parameters.
- Then, we’ll add software and service costs
- Next we’ll define the targeted output volume that we’ll need to produce
- From there, we’ll incorporate productivity levers to determine the number of resources required to produce that targeted output volume
- Finally, we’ll put it all together, to calculate the incremental impact of a switch, in terms of both net present value (NPV) and payback
Step 1: General Assumptions & Methodology
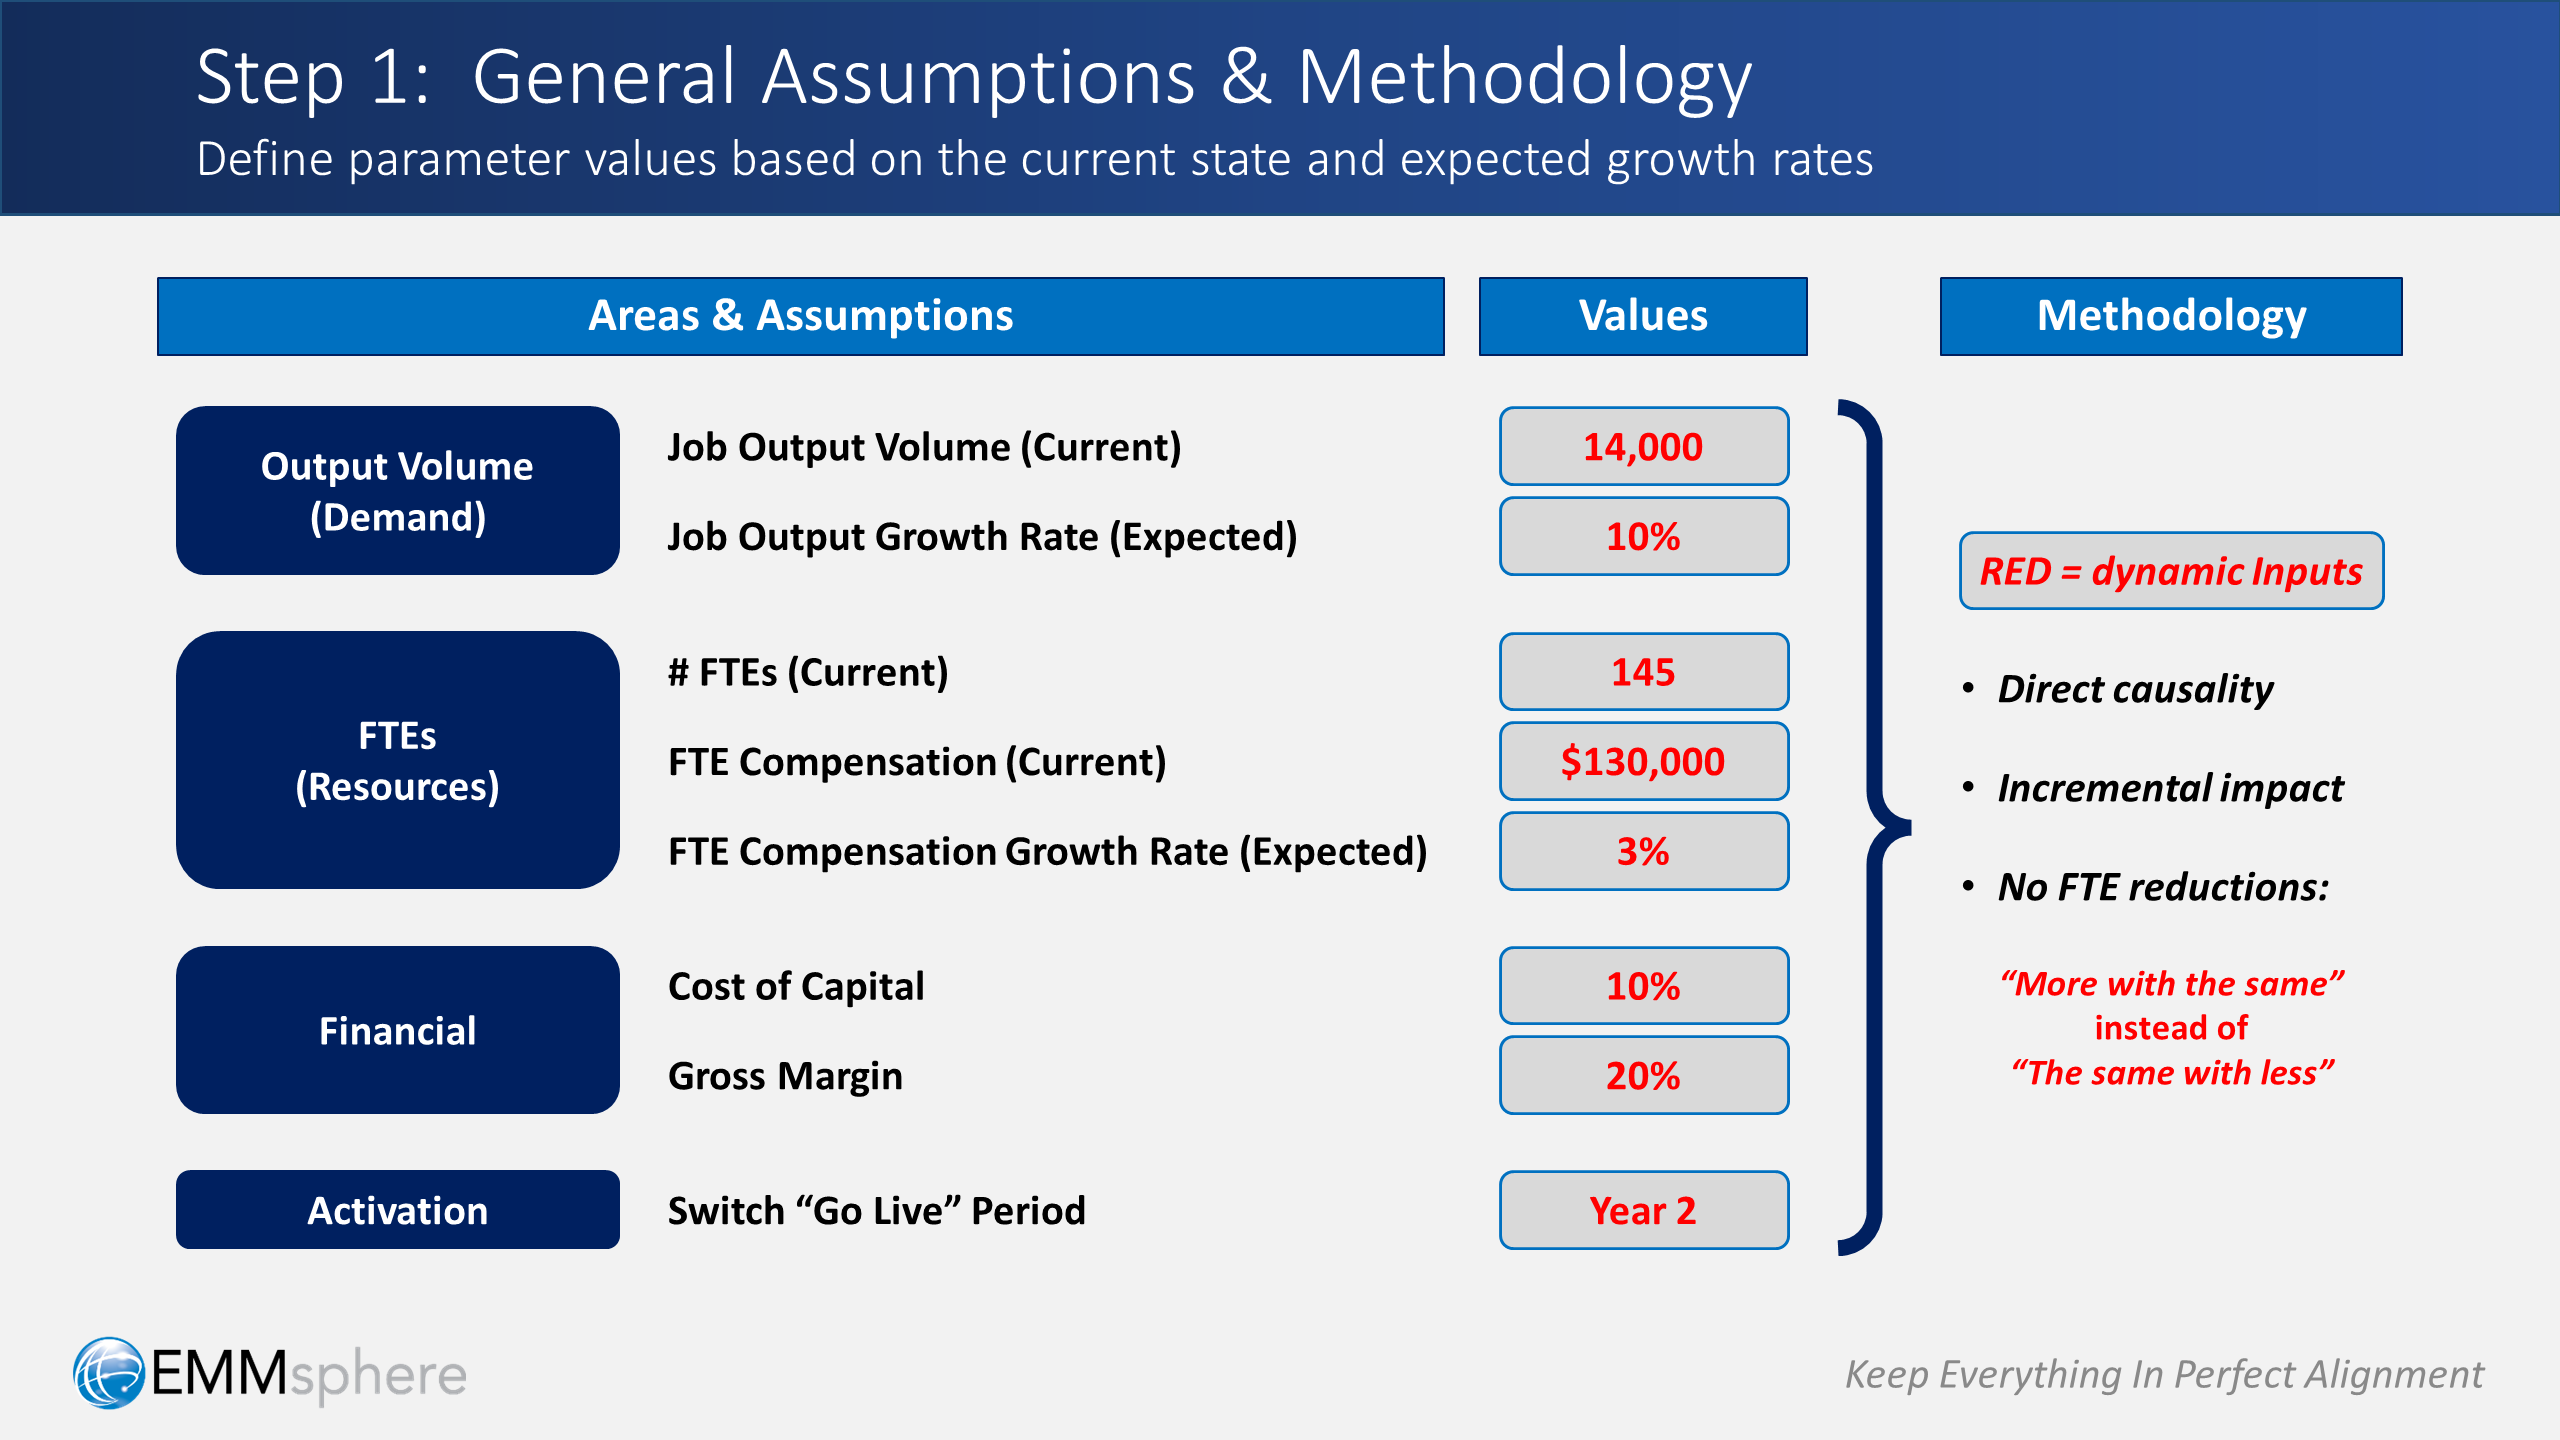
For our first step, let’s spell out some general assumptions and parameter values that we can input into our model:
- First, we specify our current marketing production volume in terms of number of jobs, and the expected growth rate going forward
- Next, we specify the number of FTEs employed to produce our current volume, their fully-loaded compensation, and growth rate going forward
- Then, we put in financial parameters for cost of capital and gross margin
- We also indicate the particular year that the switch will go live
Now, in terms of methodology, the values shown in red in the image above are all dynamic inputs, allowing us to easily calculate different scenarios.
Also, as a foundational point, our model does not allow for FTE reductions — because after all, it’s productivity we’re after, as opposed to efficiency:
Step 2: Software Costs
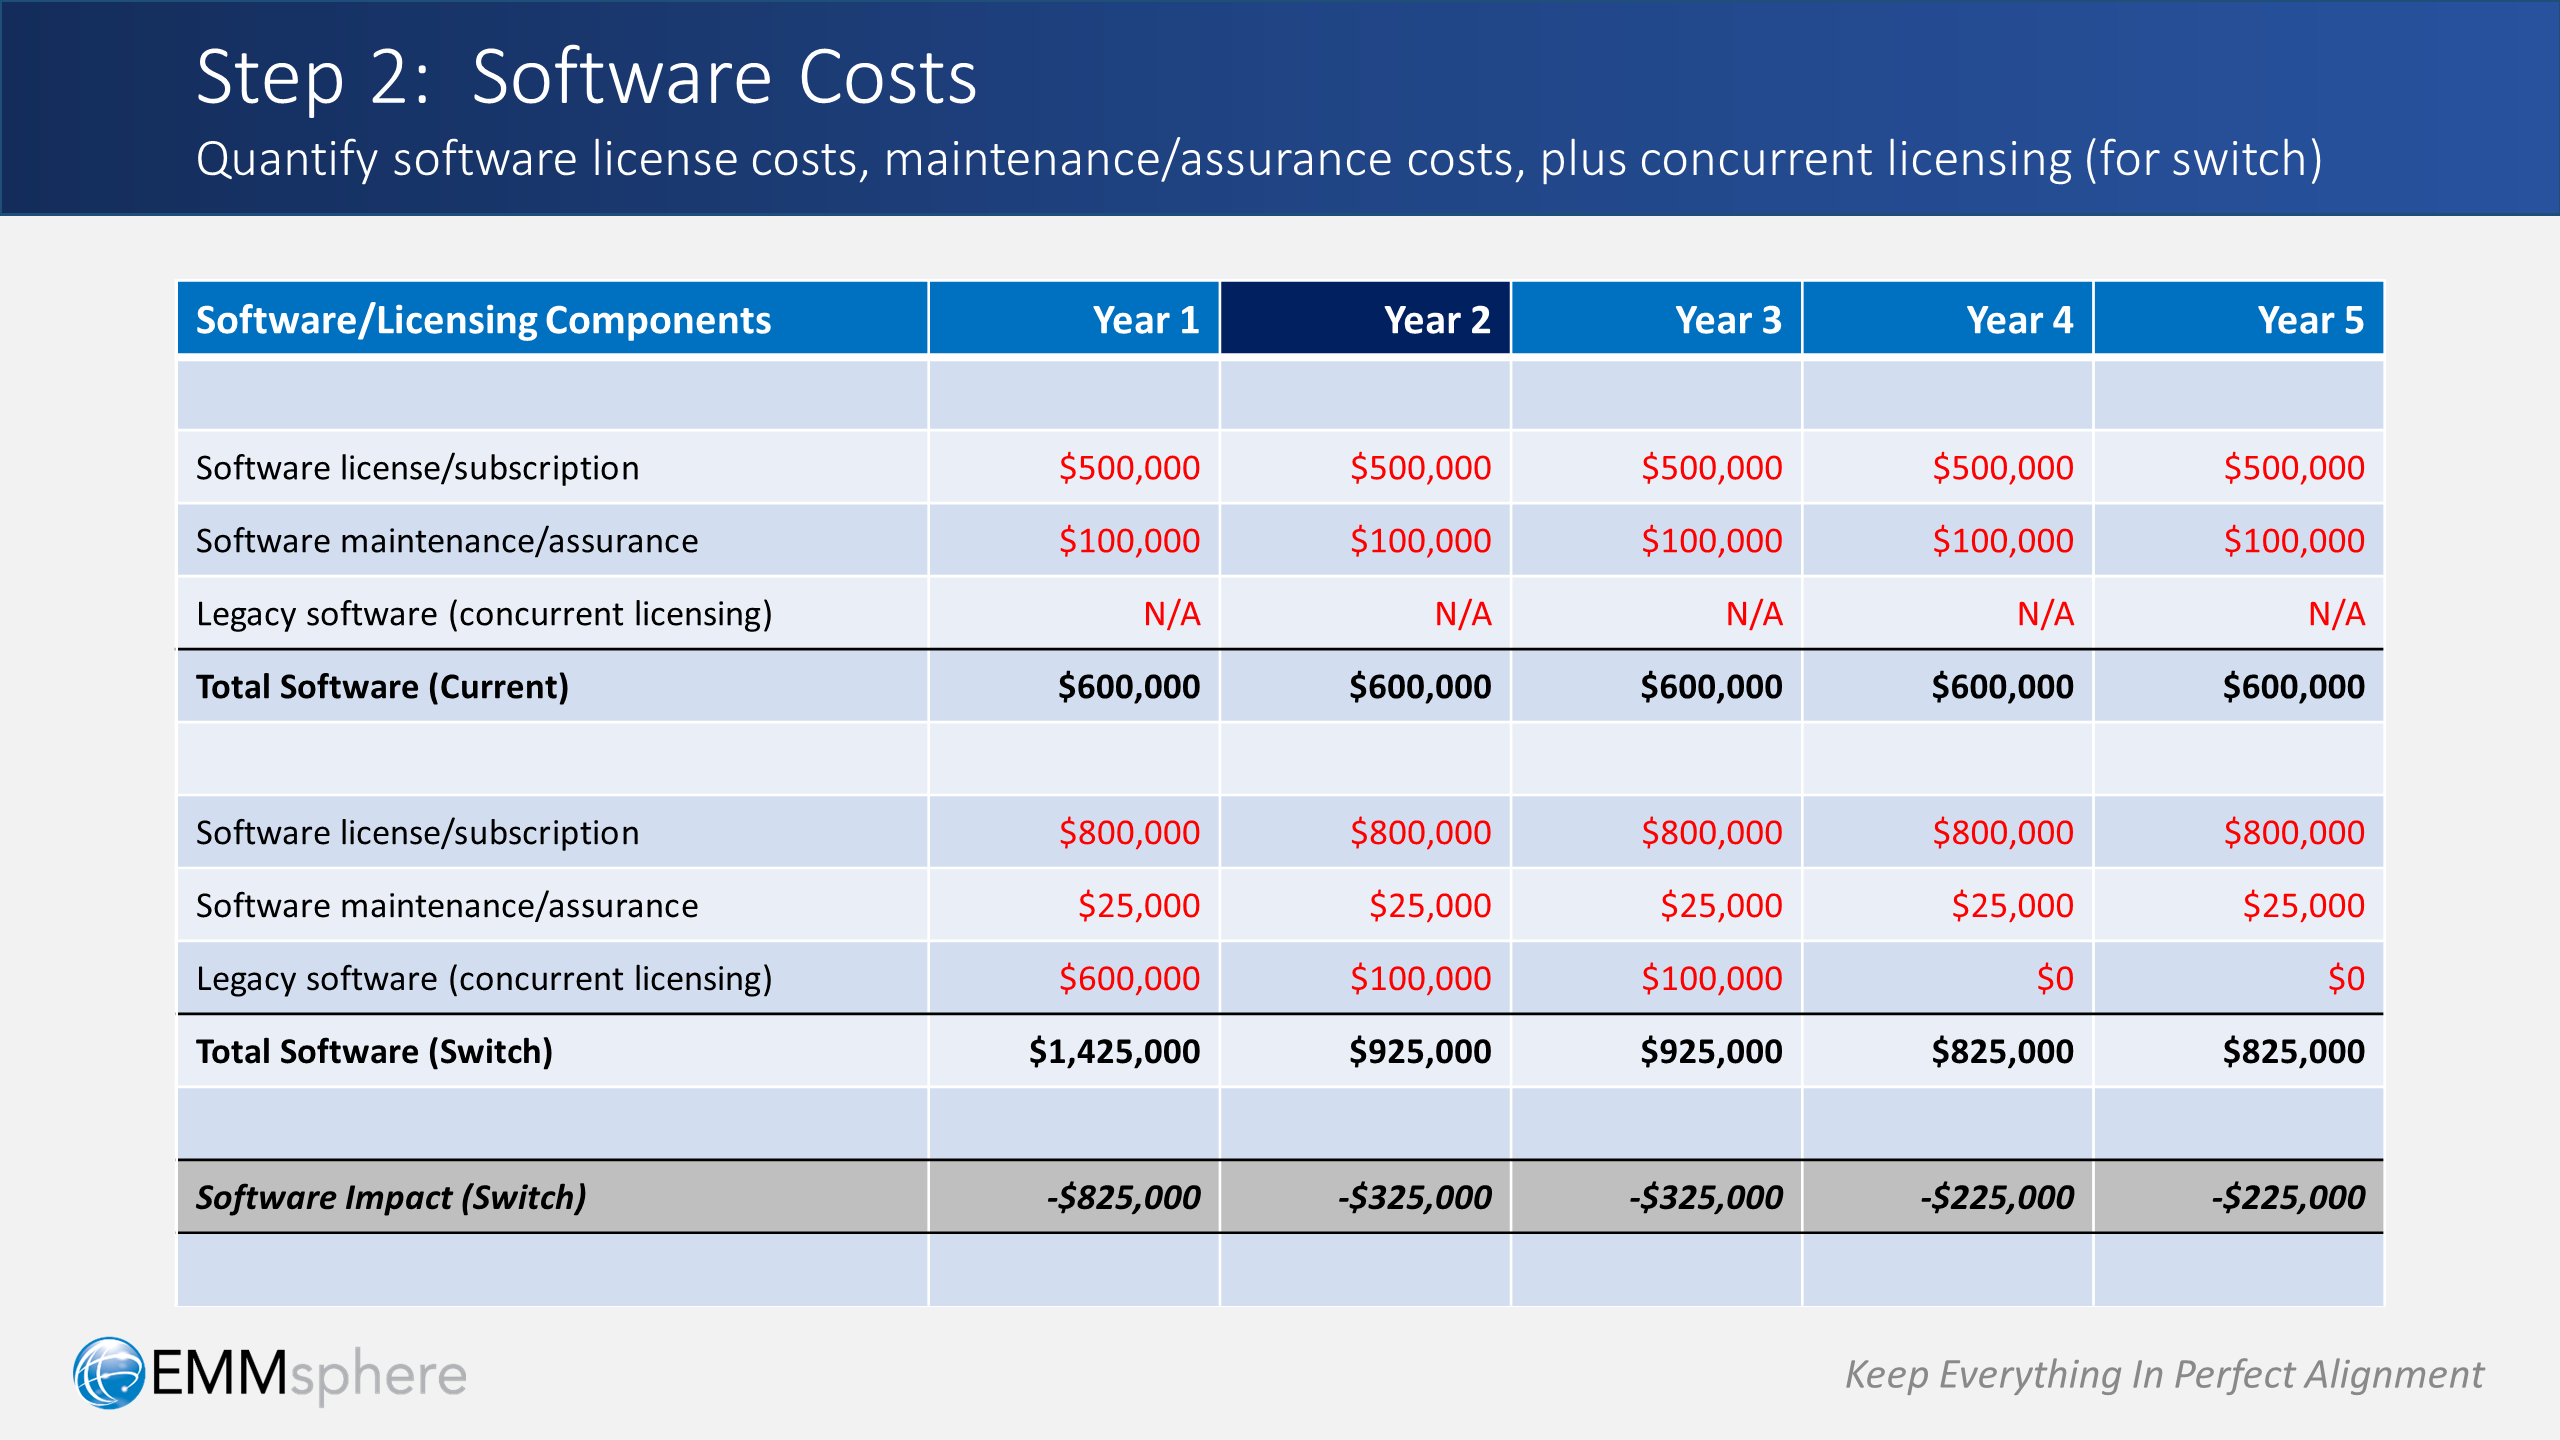
Now for Step 2, let’s put in expected software costs:
- For the current platform, we indicate our existing annual licensing and maintenance fees
- For the switch platform, we indicate expected licensing and maintenance, including costs for concurrent licensing of the existing platform, which we expect to phase out after the switch goes live in Year 2
Putting it all together, we can calculate the software impact of the switch, which may possibly entail some additional costs, especially in years 1 and 2.
Step 3: Service Costs
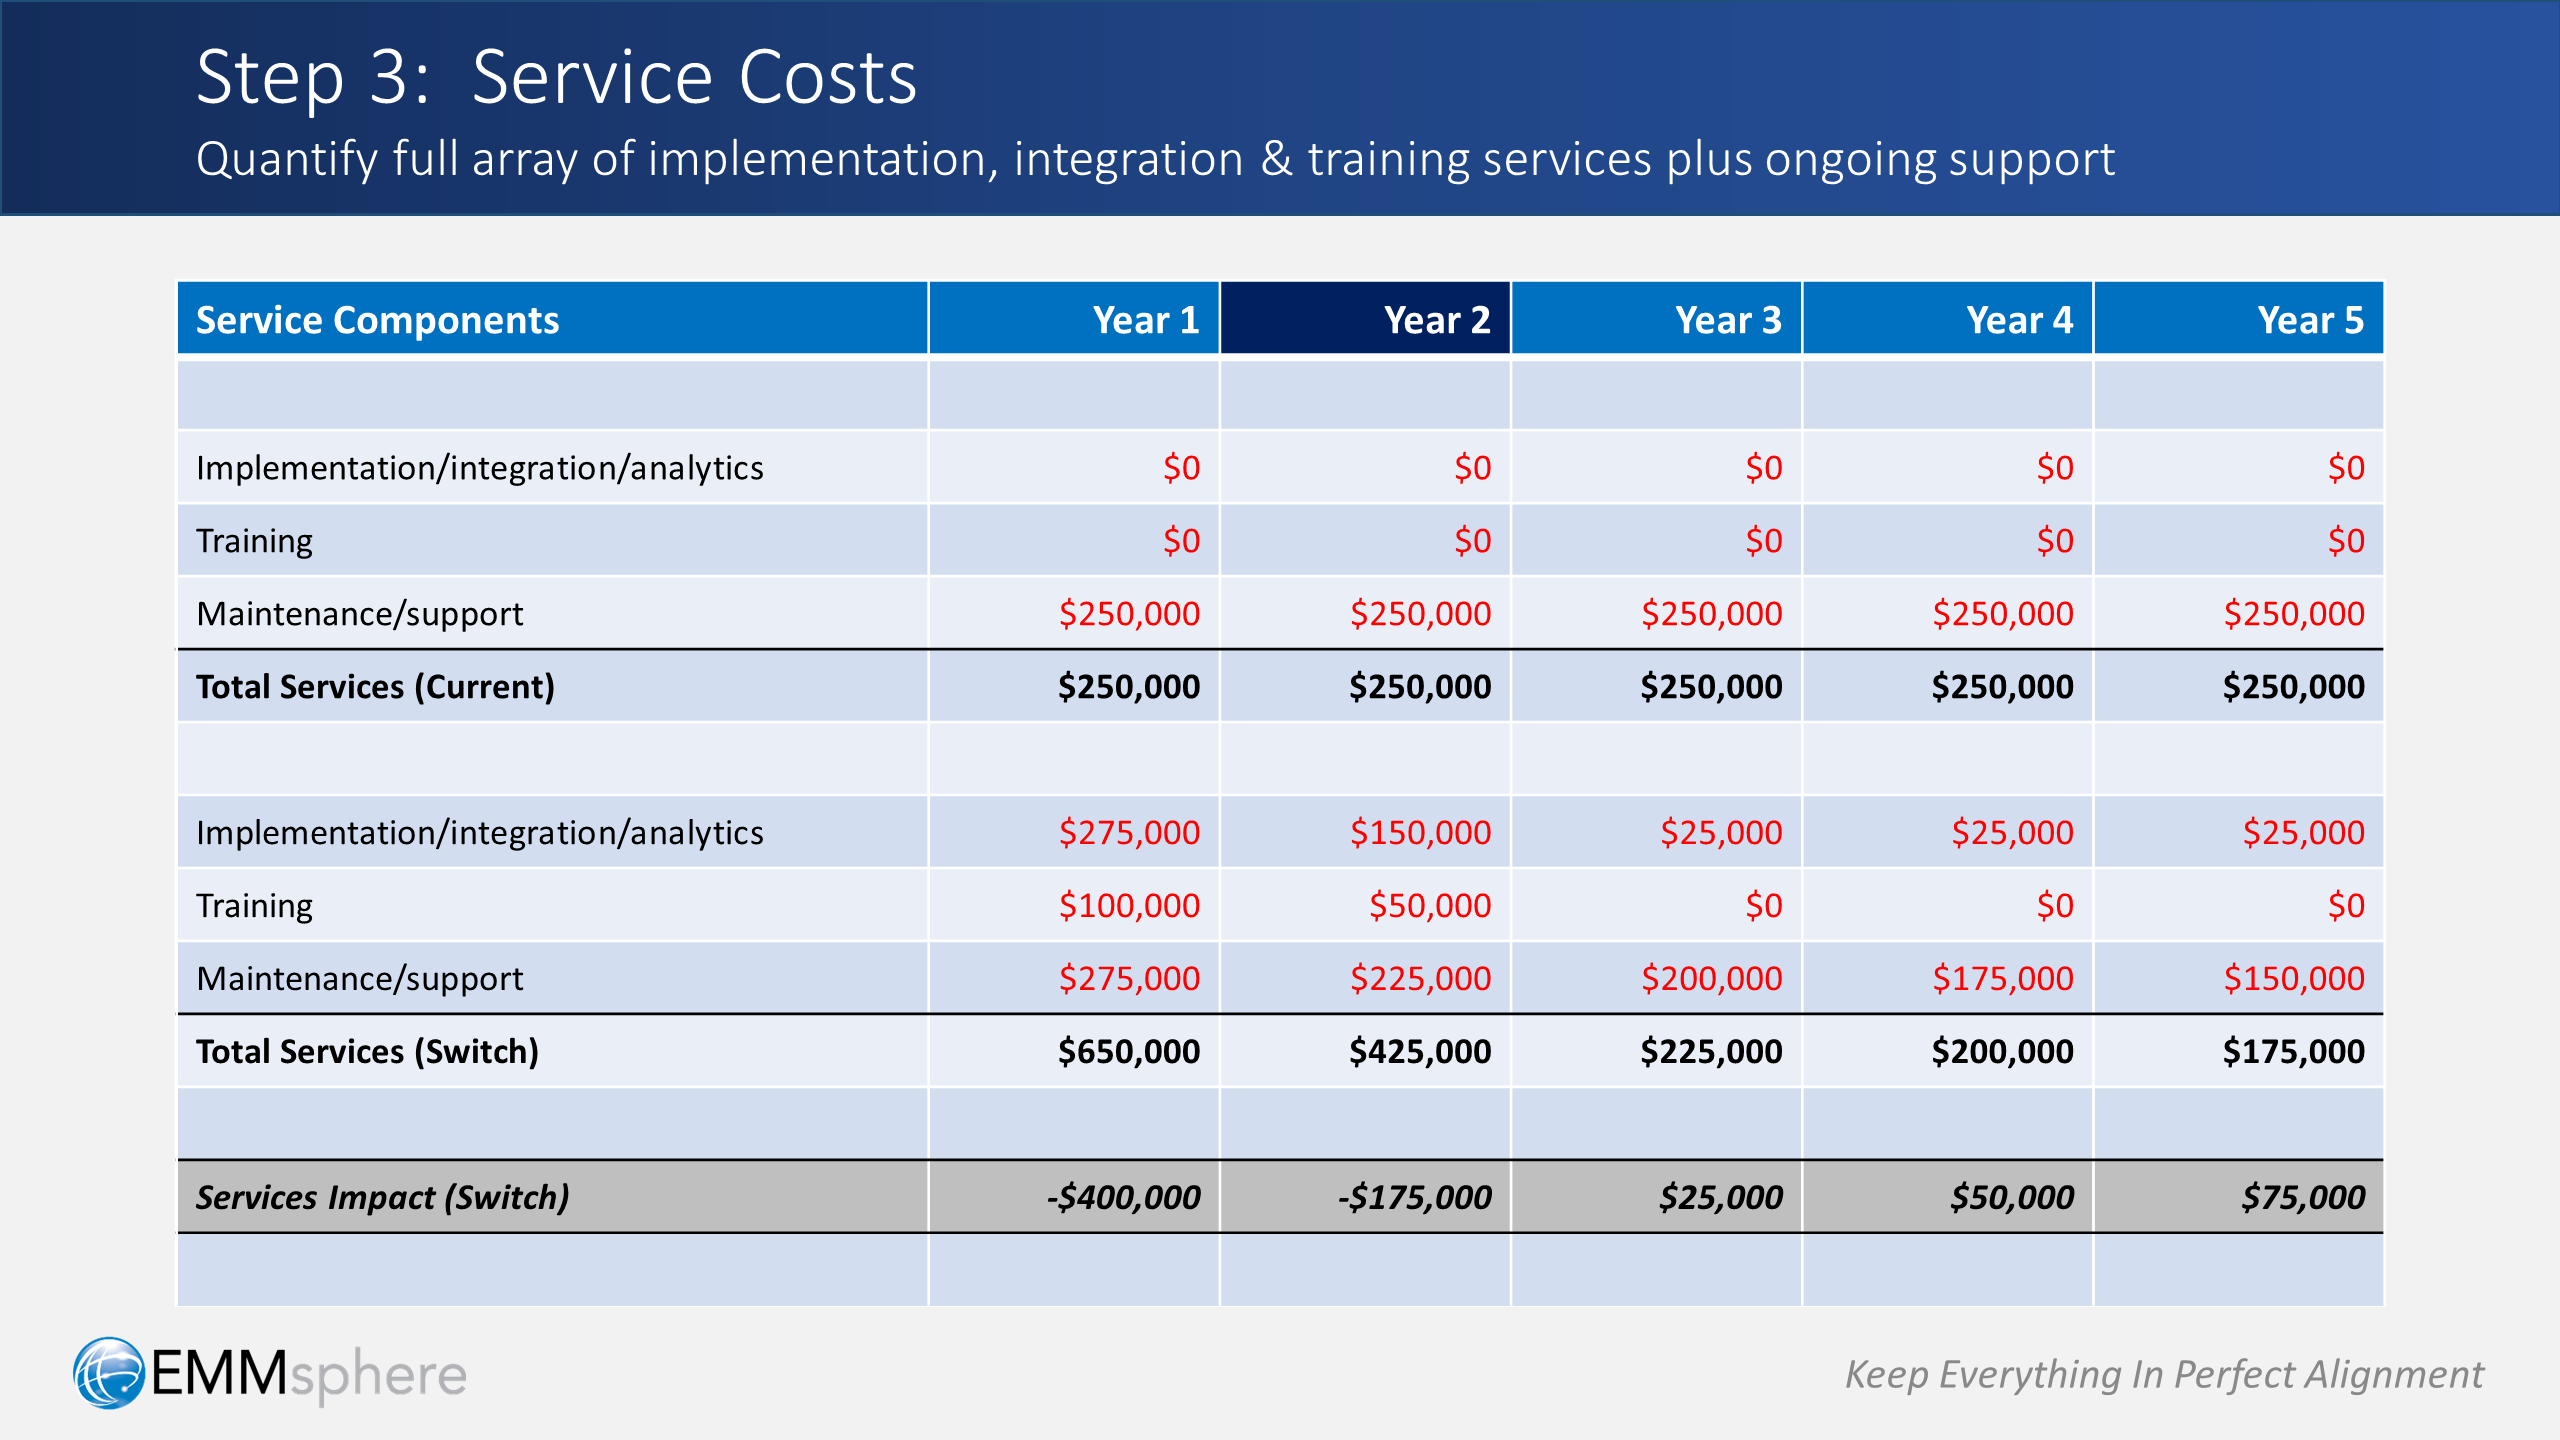
For Step 3, we put in expected service costs:
- For the current platform, we indicate our existing maintenance and support contracts
- For the switch, we’ll have implementation and integration costs in Year 1 and Year 2 as we build out the new solution, and we’ll also have training costs as we gear up to go live in Year 2
- We also include maintenance and support, which we can expect to decline over time, especially as we phase out our current solution
Putting these together, we get the service impact of the switch, which means added costs in Years 1 and 2, but an expected decrease thereafter.
Step 4: Output Volume
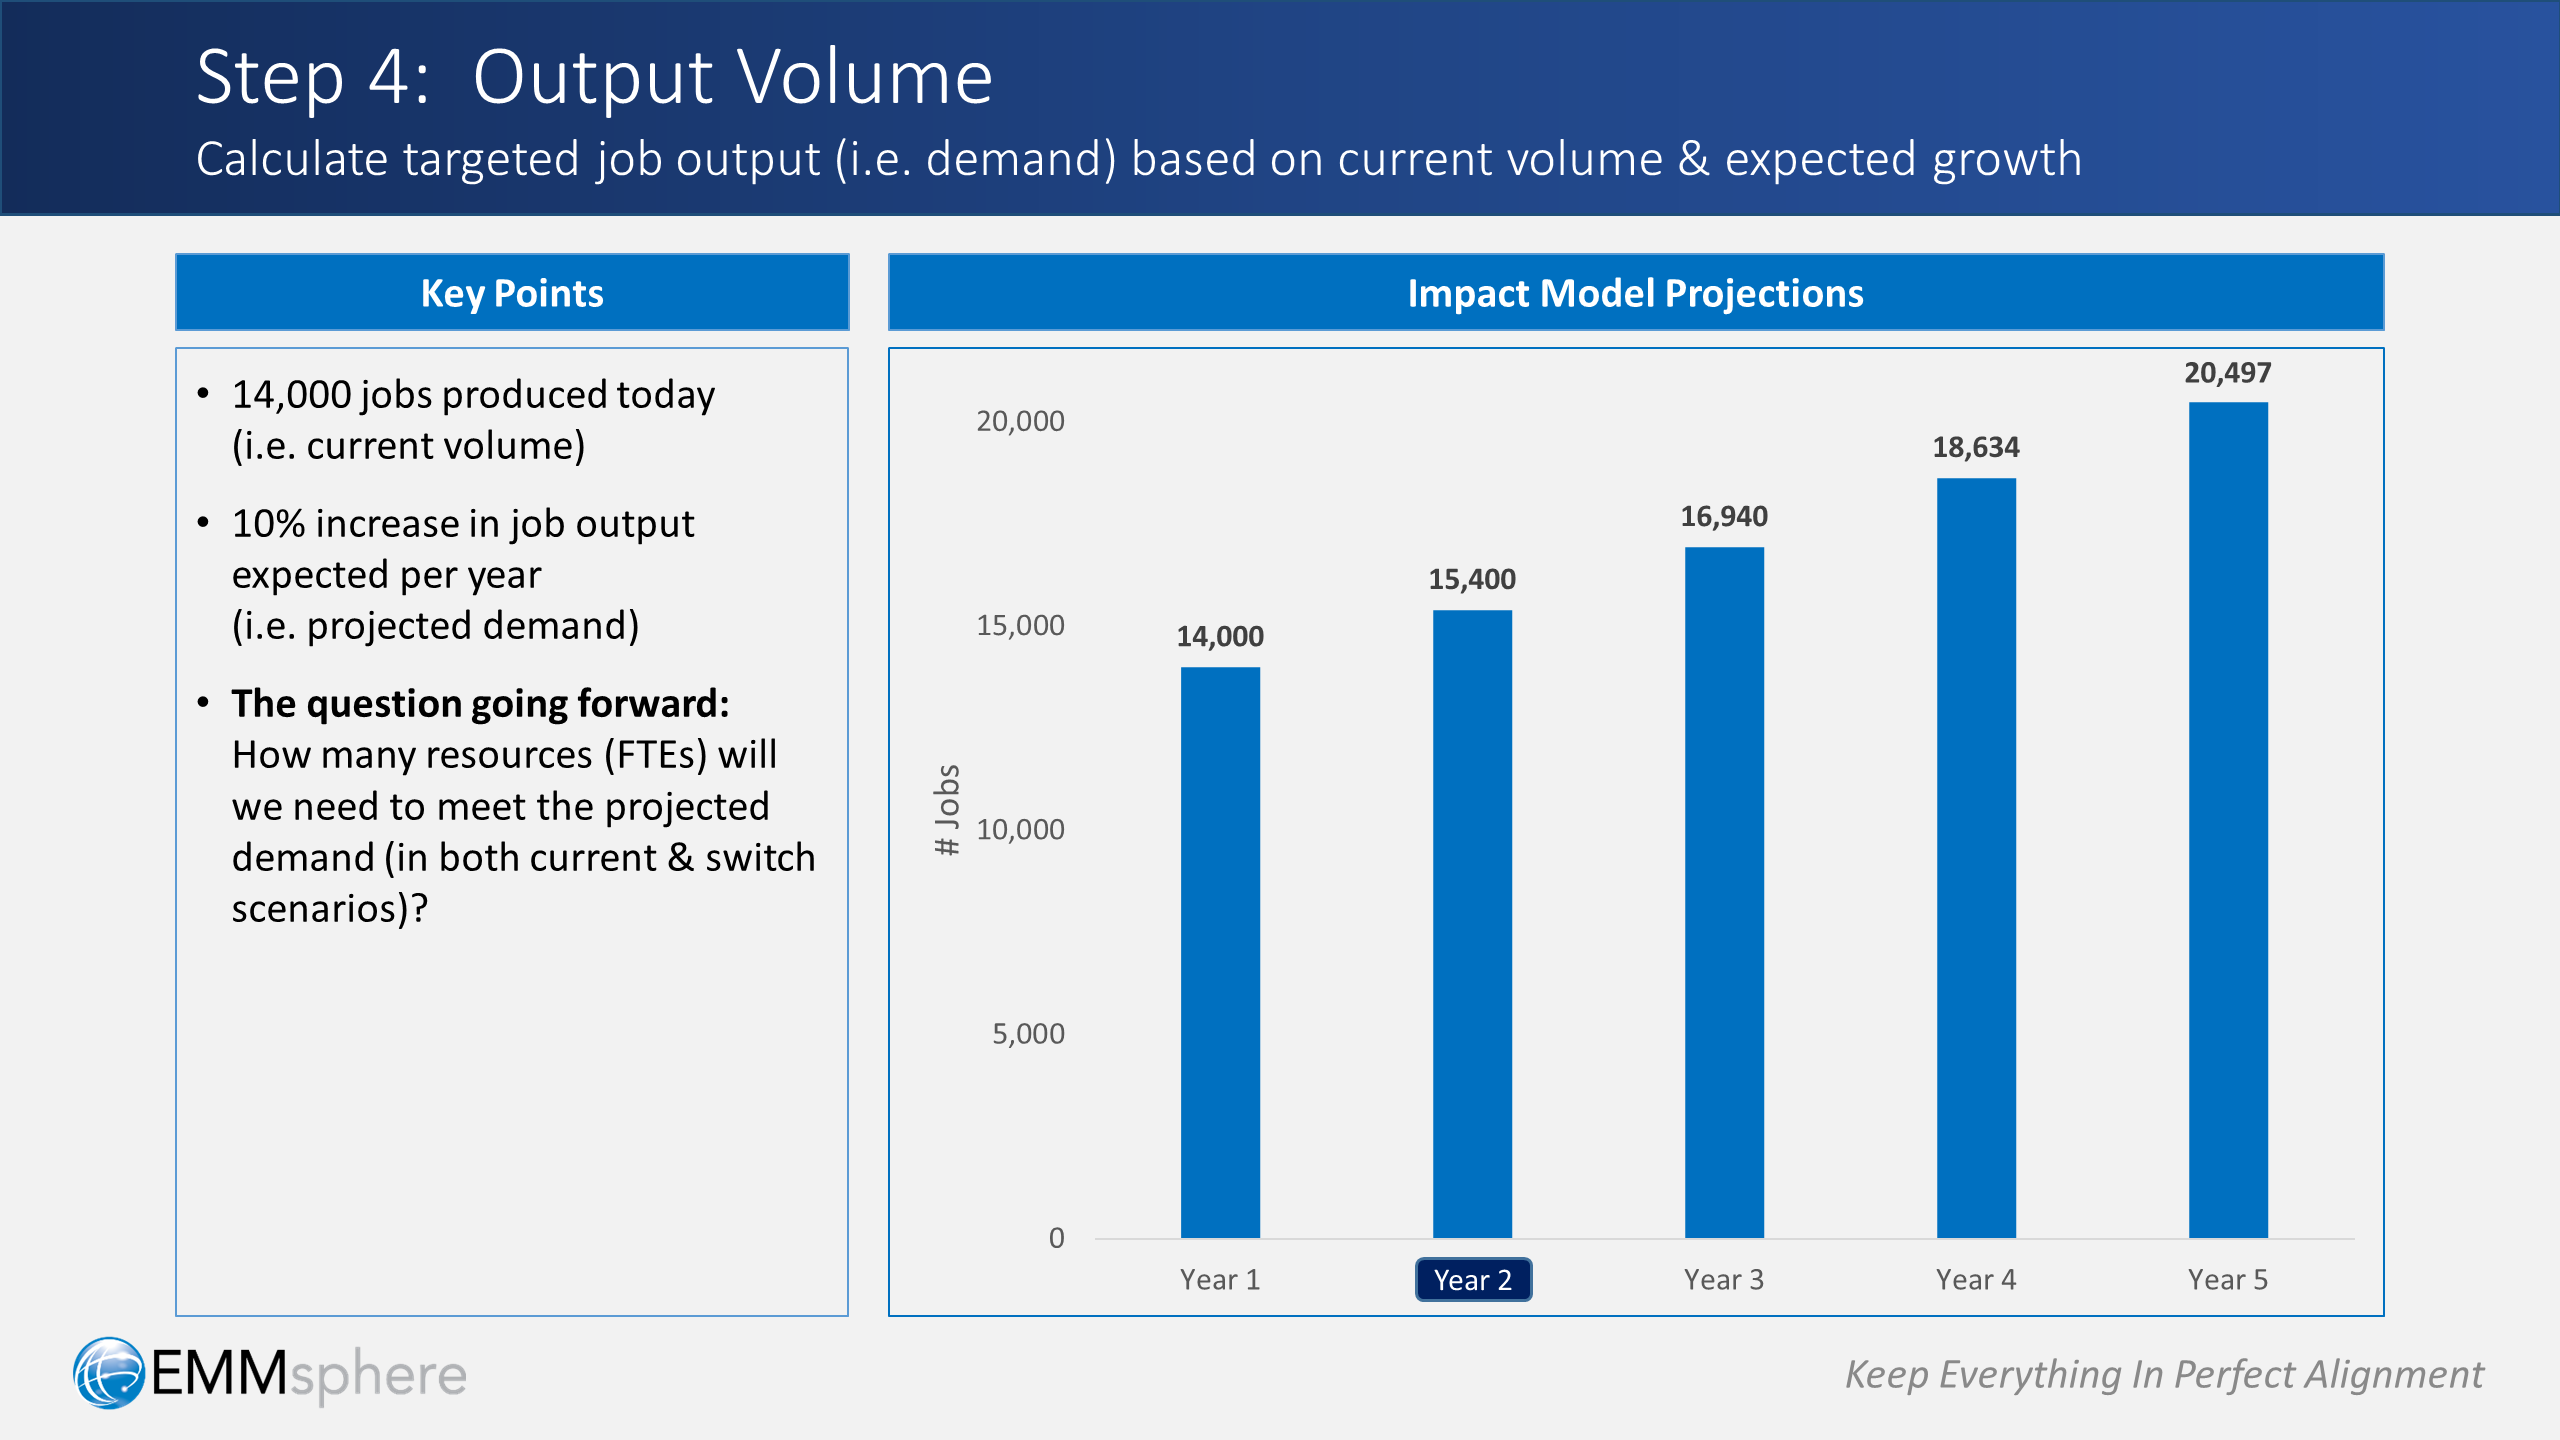
Now, in Step 4, we calculate our expected marketing output volume, meaning, the projected demand for marketing materials that we will need to meet going forward:
- As we noted in the assumptions, we currently produce 14,000 jobs today
- Applying the expected 10% growth rate, we can get our targeted job volume for each year — which, in effect, is our projected demand curve
With the demand projections now calculated in the model, the question we want to answer going forward is this: how many FTEs will we need in order to meet the projected demand, for both the current & switch platforms?
Step 5: Job Output & Productivity Levers
The “Fully-Loaded” Job Output
To answer that question of how many FTEs we’ll need to meet demand, we incorporate productivity levers, which is the next step in our model, and probably the most important step overall.
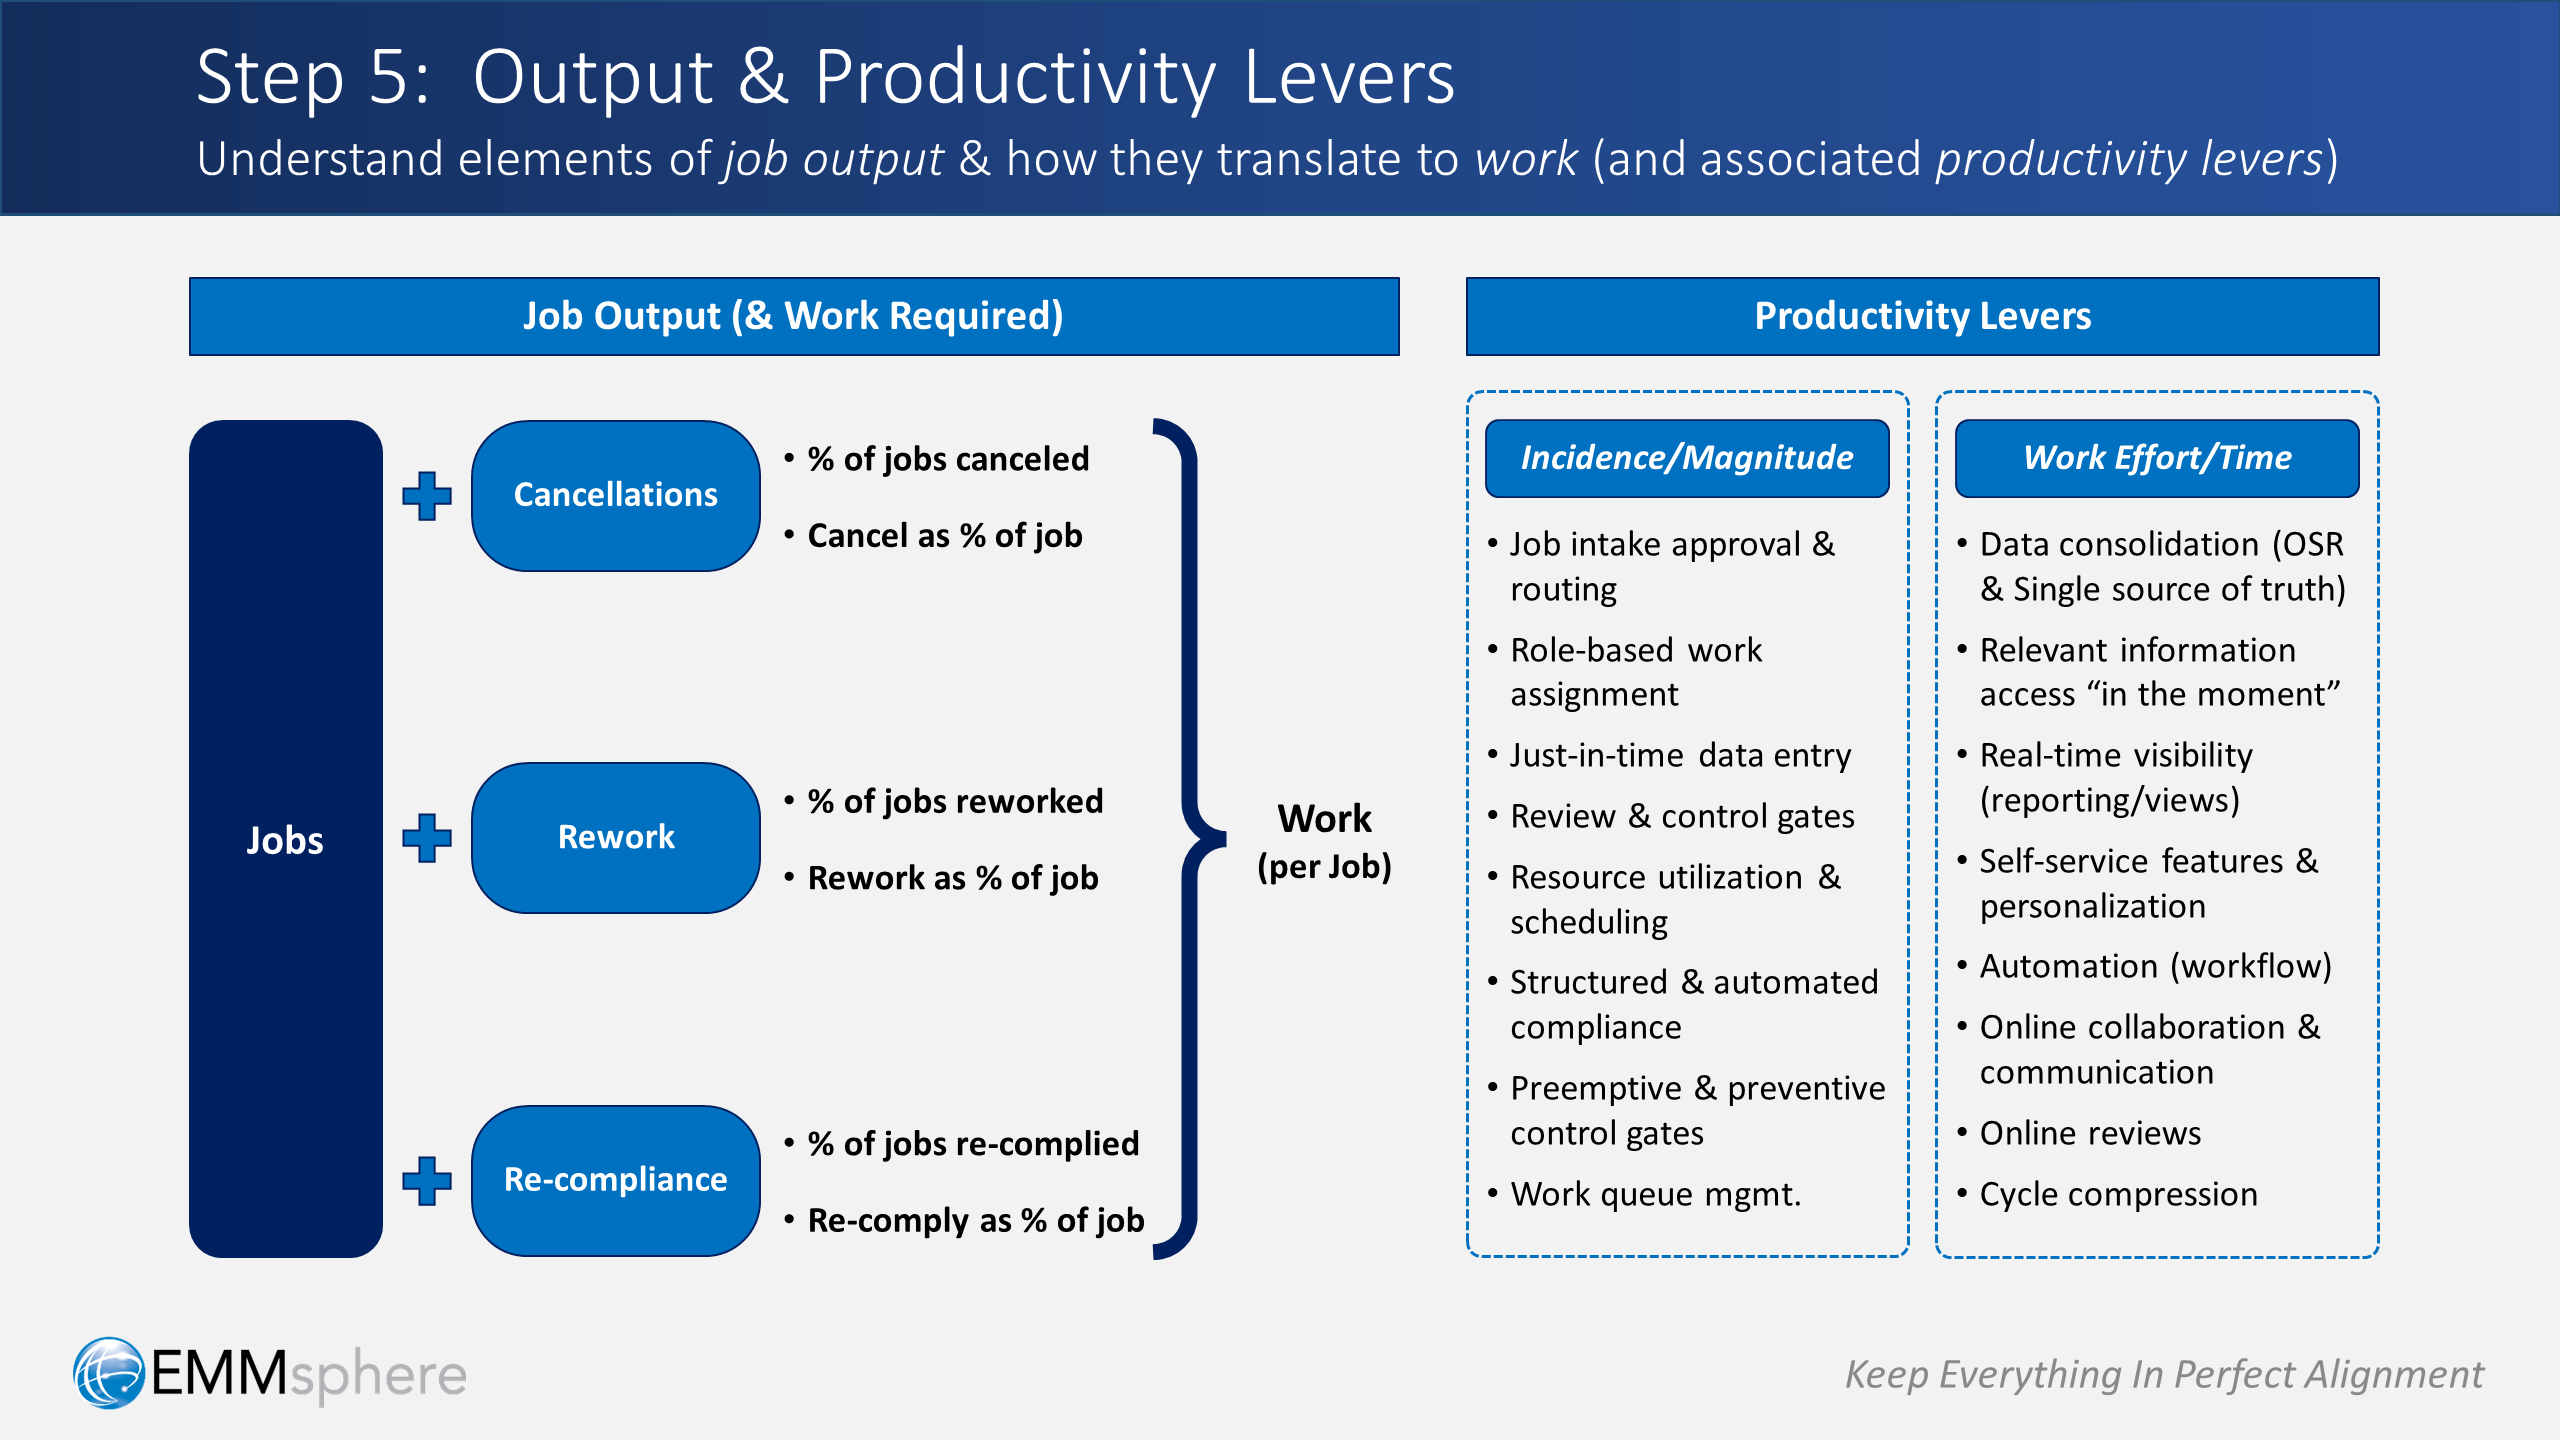
Basically, what we need to do is understand the elements of job output, and how they translate to work input. Then, we can identify the productivity levers that will determine the amount of work that we’ll need to do in order to produce our targeted output.
With respect to the first part of that, i.e. understanding the elements of Job Output: the first element in job output is the job itself.
But, for all the jobs we produce, we’ll also incur some level of job cancellations, which are basically jobs that were never completed. So, how much of our output becomes cancellations? Well, some percentage of jobs get canceled, and when they do get canceled, those jobs are some percentage of the way to completion.
Similarly, for all the jobs we produce, we will also incur some level of job rework, which we can think of as jobs that get held up in review and revise cycles.
And, we will also incur some level of job re-compliance, which are jobs that get rejected for compliance or regulatory purposes, and therefore need remediation.
Adding it all up, we get a sense of the “fully-loaded” output that is involved in the production of complete jobs, which is the sum total of:
- The completed jobs themselves
- Canceled jobs (that are never completed)
- Rework jobs (extra “overhead” on jobs that require revisions)
- Re-compliance jobs (extra “overhead” on jobs that require remediation)
So now that we have our total fully-loaded job output, we can translate that into the work needed to produce that output. In short: job output will require some level of work input.
So, the next consideration we need to take into account is: what factors might influence the specific values we place on all of these variables?
Productivity Lever Considerations
That’s where productivity levers come in. When trying to determine realistic values for all of these variables, we consider two basic types of productivity levers.
- Incidence & magnitude-related productivity levers: these govern the number of cancellations, rework and re-complies
- Work effort/time productivity lever: which governs the amount of effort involved in producing one job unit
The tricky part is to decide on appropriate values for each these types of levers, which typically involves some level of debate in order to weigh the potential influence of various work management concepts on our expectations for productivity improvements.
In fact, this debate is something we always do in collaboration with the client team. After all, the idea is to decide on values that are reasonable for them and their particular organization and situation.
Again, there is no one and only right answer. It takes judgement and experience. But, a healthy brainstorming session usually helps everyone arrive at values they feel good about. And, to help guide this debate, there are a number of concepts to consider.
For example, for the incidence and magnitude productivity levers, topics such as these are likely relevant:
- Job intake approval & routing
- Role-based work assignment
- Just-in-time data entry
- Review & control gates
- Resource utilization & scheduling
- Structured & automated compliance
- Preemptive & preventive control gates
- Work queue management
And, for the work effort/time productivity lever, factors like the following can influence the lever’s value:
- Data consolidation (OSR & single source of truth)
- Relevant information access “in the moment”
- Real-time visibility (i.e. reporting/views)
- Self-service features & personalization
- Automation & workflow
- Online collaboration & communication
- Online reviews
- Cycle compression
Productivity Lever Input Values
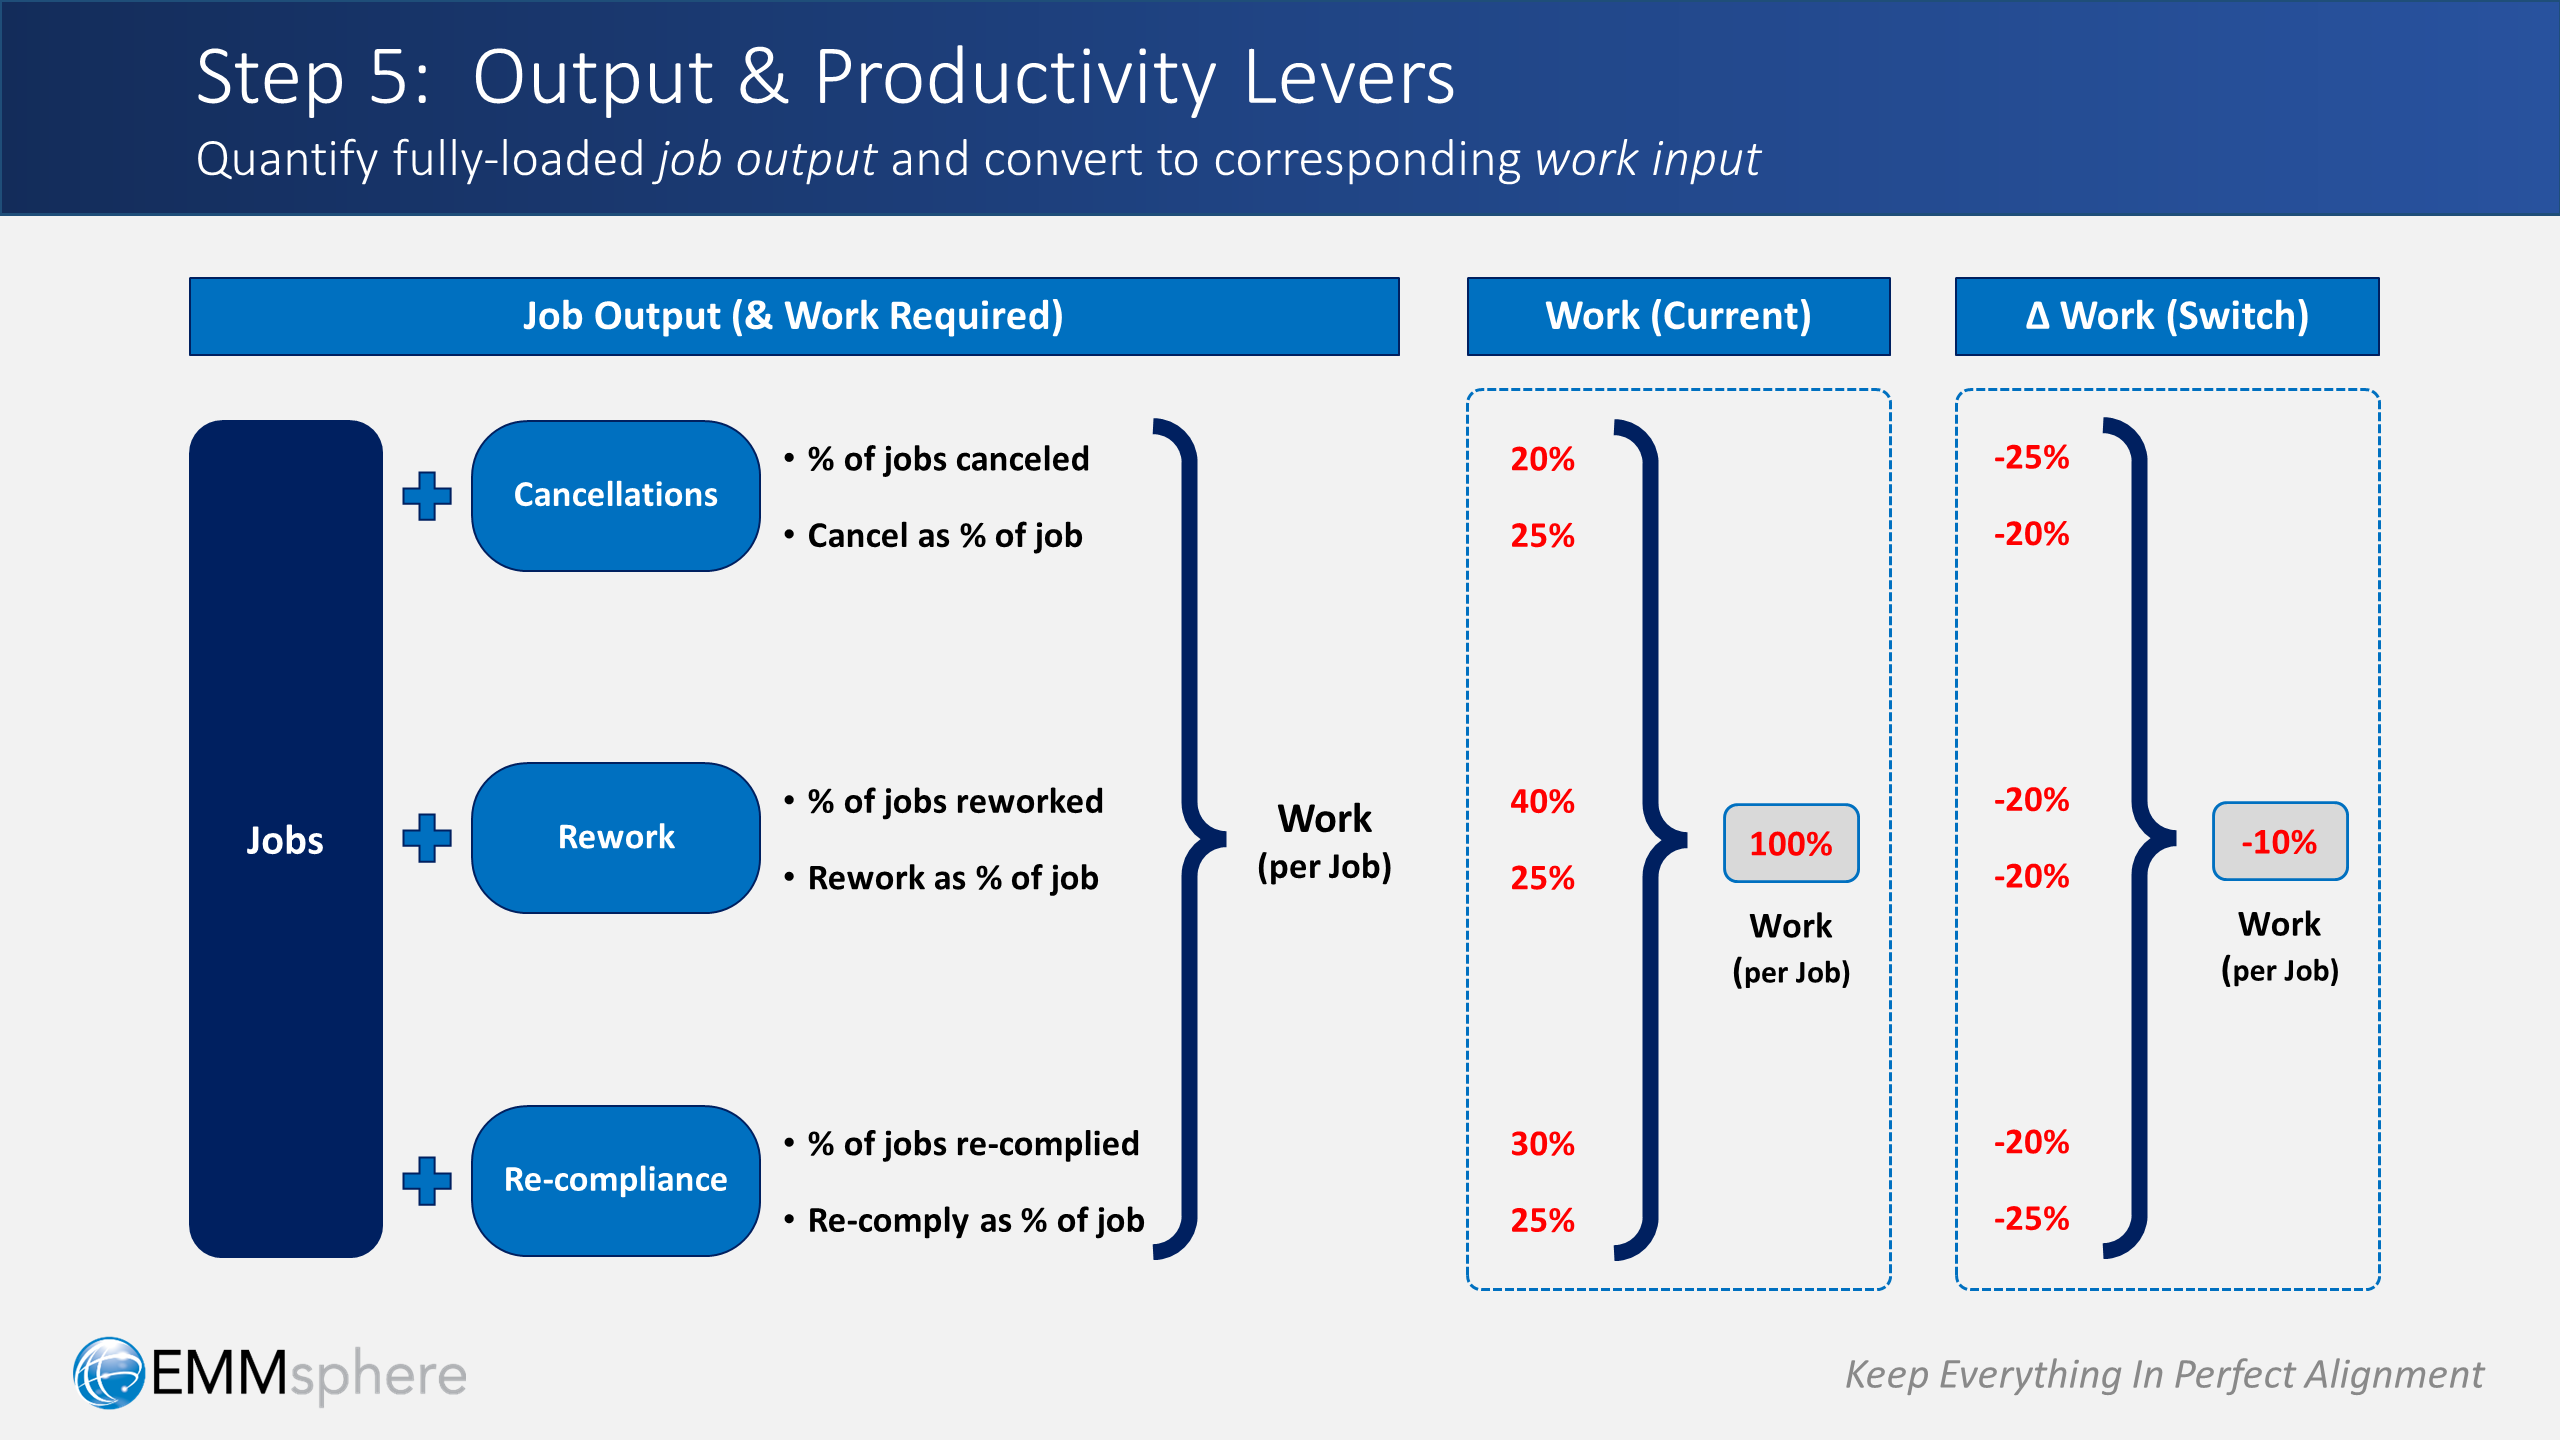
So how might these productivity lever values actually look? Well, taking an average across several clients we’ve served over the years, we’ve found that:
- For their current solutions, large organizations typically experienced about a 20% to 40% incidence of cancellations, rework and re-compliance, with about a 25% magnitude across all three of these
- However, when organizations carefully considered the potential productivity improvements from a platform switch, they typically expected the incidence and magnitude (i.e. volume) of cancellations, rework and re-compliance to decrease by 20% to 25%
- Additionally, they expected the amount of work needed per job to decrease by about 10%
Productivity Lever Output Values
Now that we’ve thoughtfully deliberated on our productivity levers, and decided on reasonable values to use for those levers, we can put those into our impact model to get some compelling insights and results:
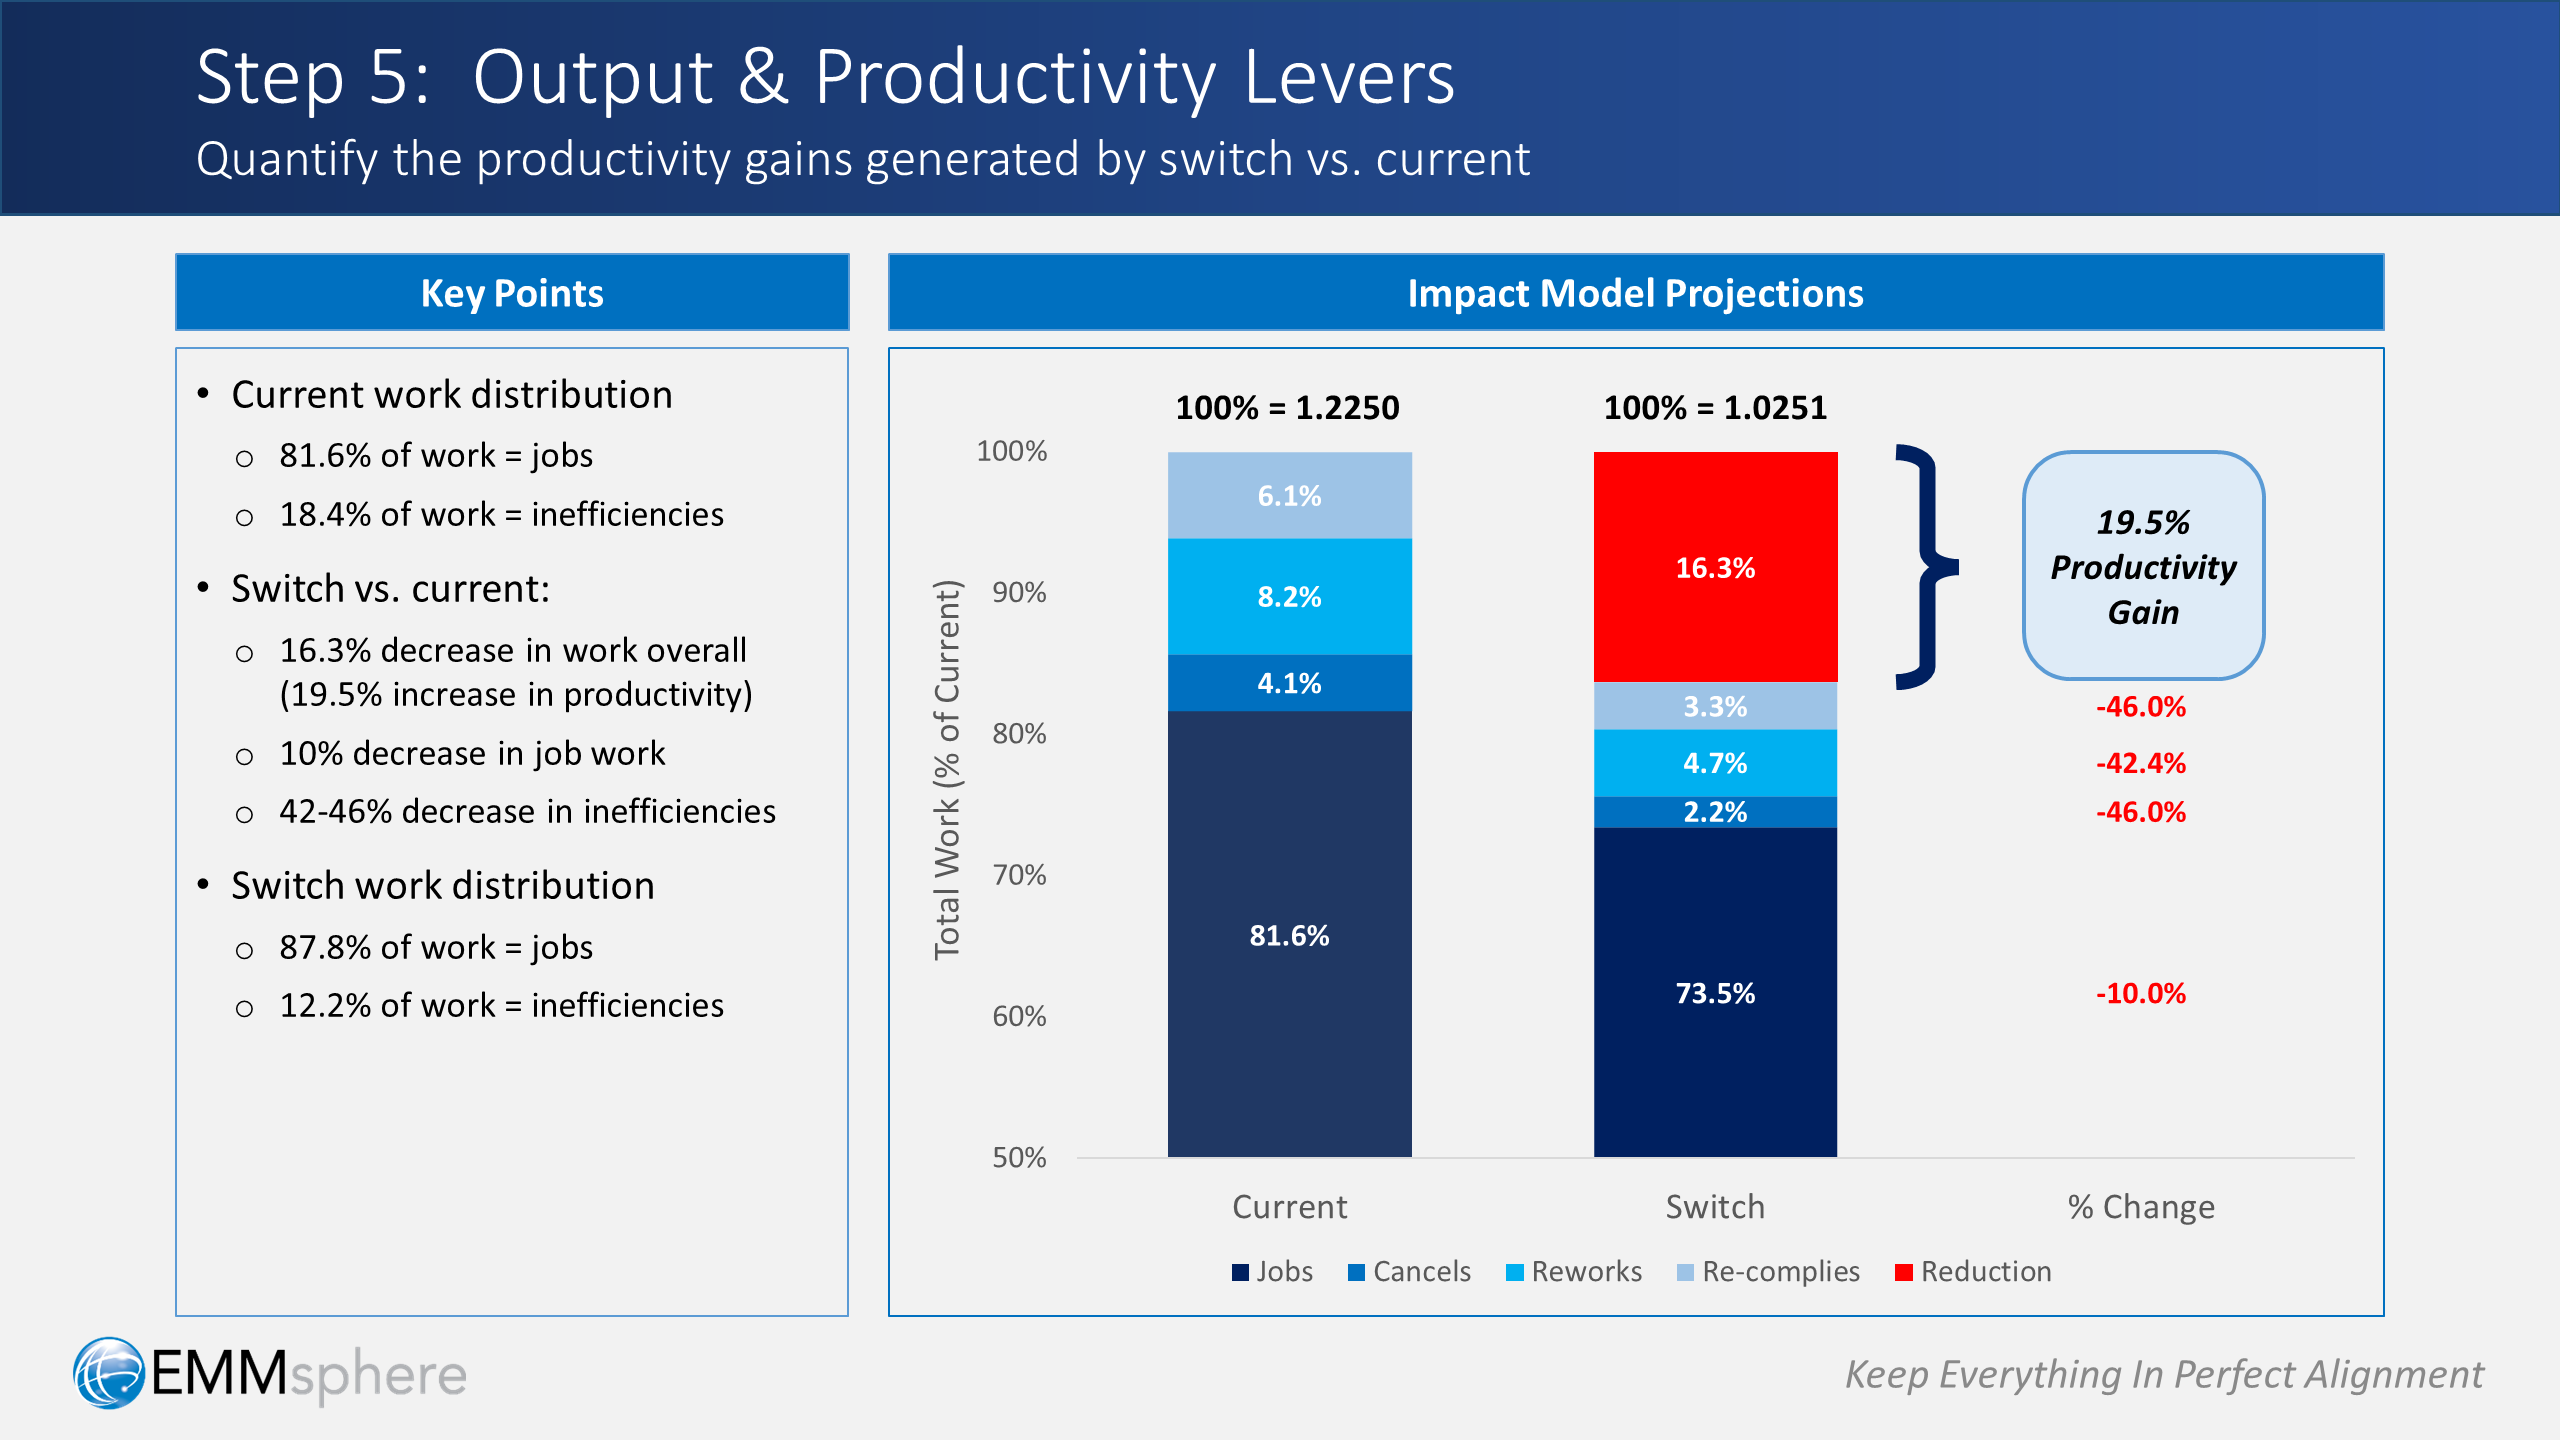
- Looking at the current work distribution, we discover that 6% of all current work goes toward the production of completed jobs, indicating that 18.4% of all current work is being spent on inefficiencies related to cancellations, rework and re-complies
- On the other hand, the productivity gains from the switch generate a 3% decrease in work overall, or in other words, a 19.5% gain in productivity
- That breaks down into a 10% decrease in job-related work, and a 42-46% decrease in cancellation, rework and re-compliance-related work
Of course, these are not absolute or definitive conclusions, nor are they intended to be.
But, with careful consideration for reasonable estimate on the input side, our model makes it very easy to quickly see how the productivity levers “work” together (pun intended) to generate substantial productivity gains.
Step 6: Projected FTEs
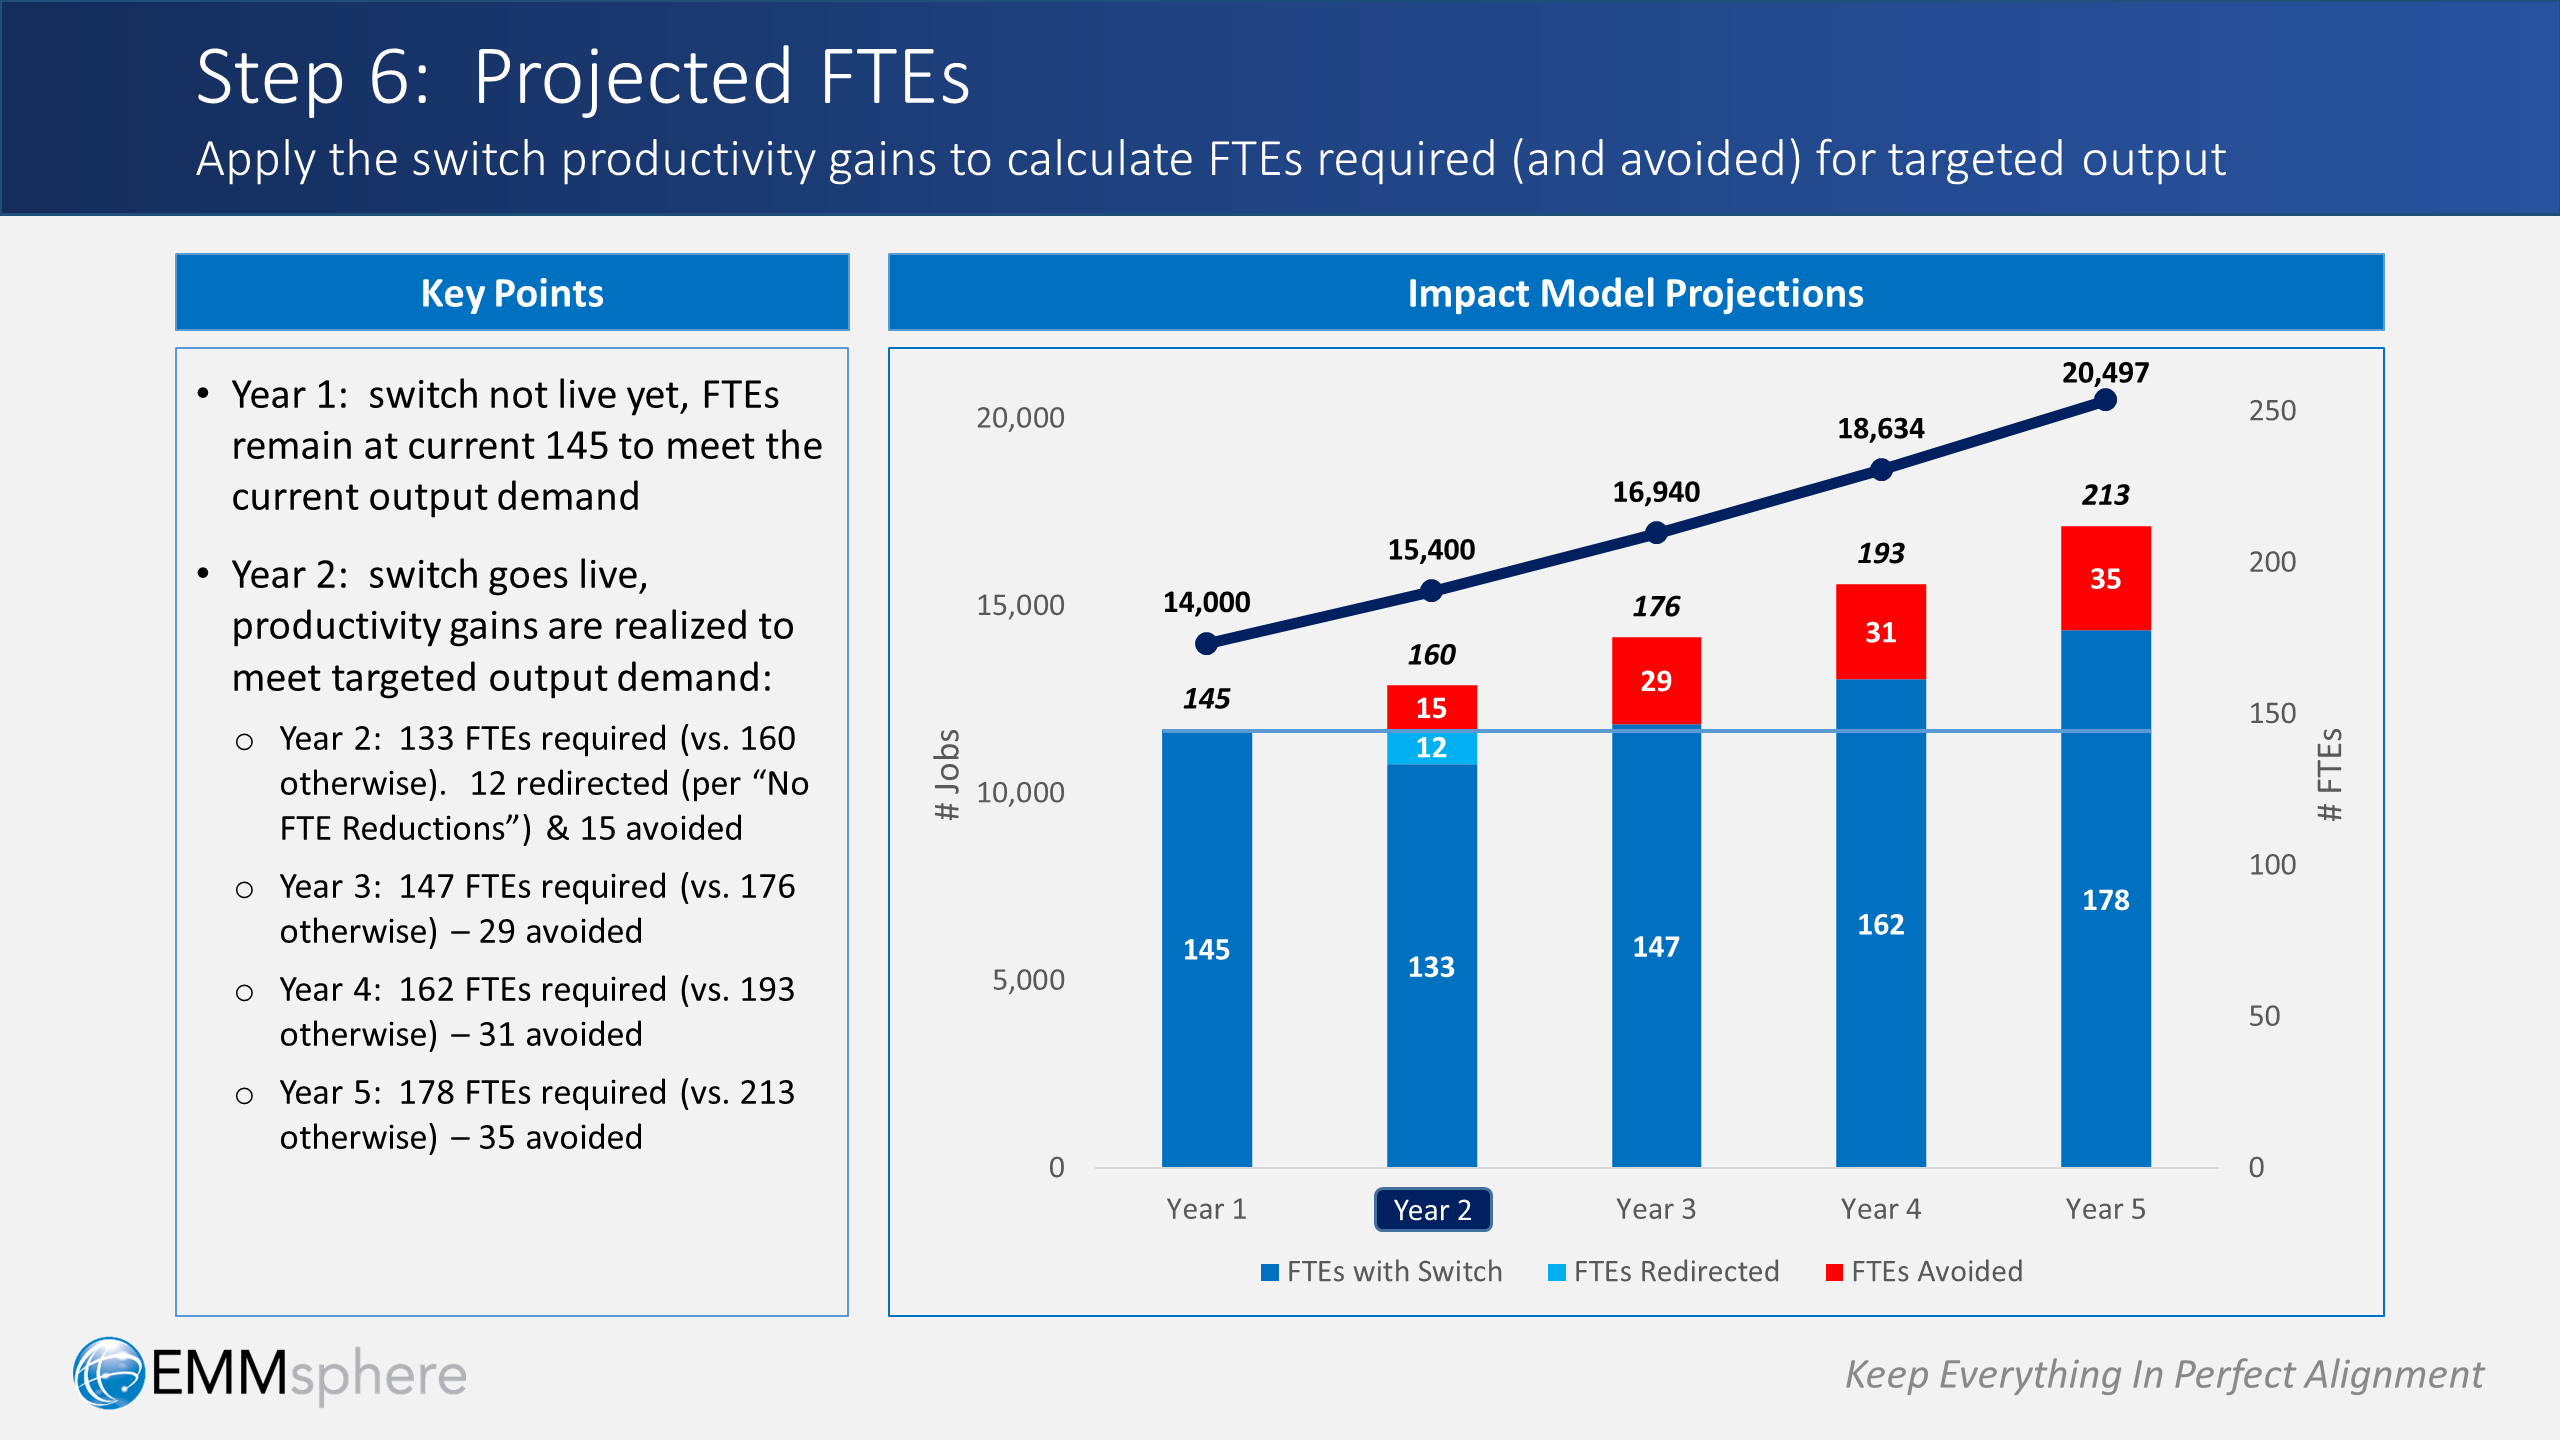
Now we reach Step 6 of our model, where we can finally answer the key question we mentioned earlier: given all of the expected productivity gains, how many FTEs will we need going forward in order to produce our targeted job output volume?
The chart shown above, generated by our model, summarizes all of the concepts we’ve talked about so far and calculates year-by-year results for us:
In Year 1: the switch is not live yet, so FTEs remain at the current 145, to produce the current output demand of 14,000 jobs.
In Year 2: the switch goes live, so the productivity gains start to kick in.
To meet the targeted job output volume, we will need 133 FTEs under the switch, as opposed to the 160 FTEs that we would have otherwise under the current solution.
But remember: as we noted earlier, FTE reductions are not allowed! So, we will still have our existing 145 FTEs regardless. That means we will have an extra 12 FTEs, which we can now redirect to other value-added activities. And even better, we will still avoid the need to hire 15 FTEs.
In Year 3: we will require 147 FTEs under the switch, which is 2 more than the 145 we currently have, so we’ll need to add 2 FTEs. But that’s still much less the 176 FTEs we would need otherwise, and we avoid hiring 29.
In Year 4: we will require 162, avoiding another 31.
In Year 5: we’ll need 178, avoiding 35 more.
Step 7: The Incremental NPV of a Switch
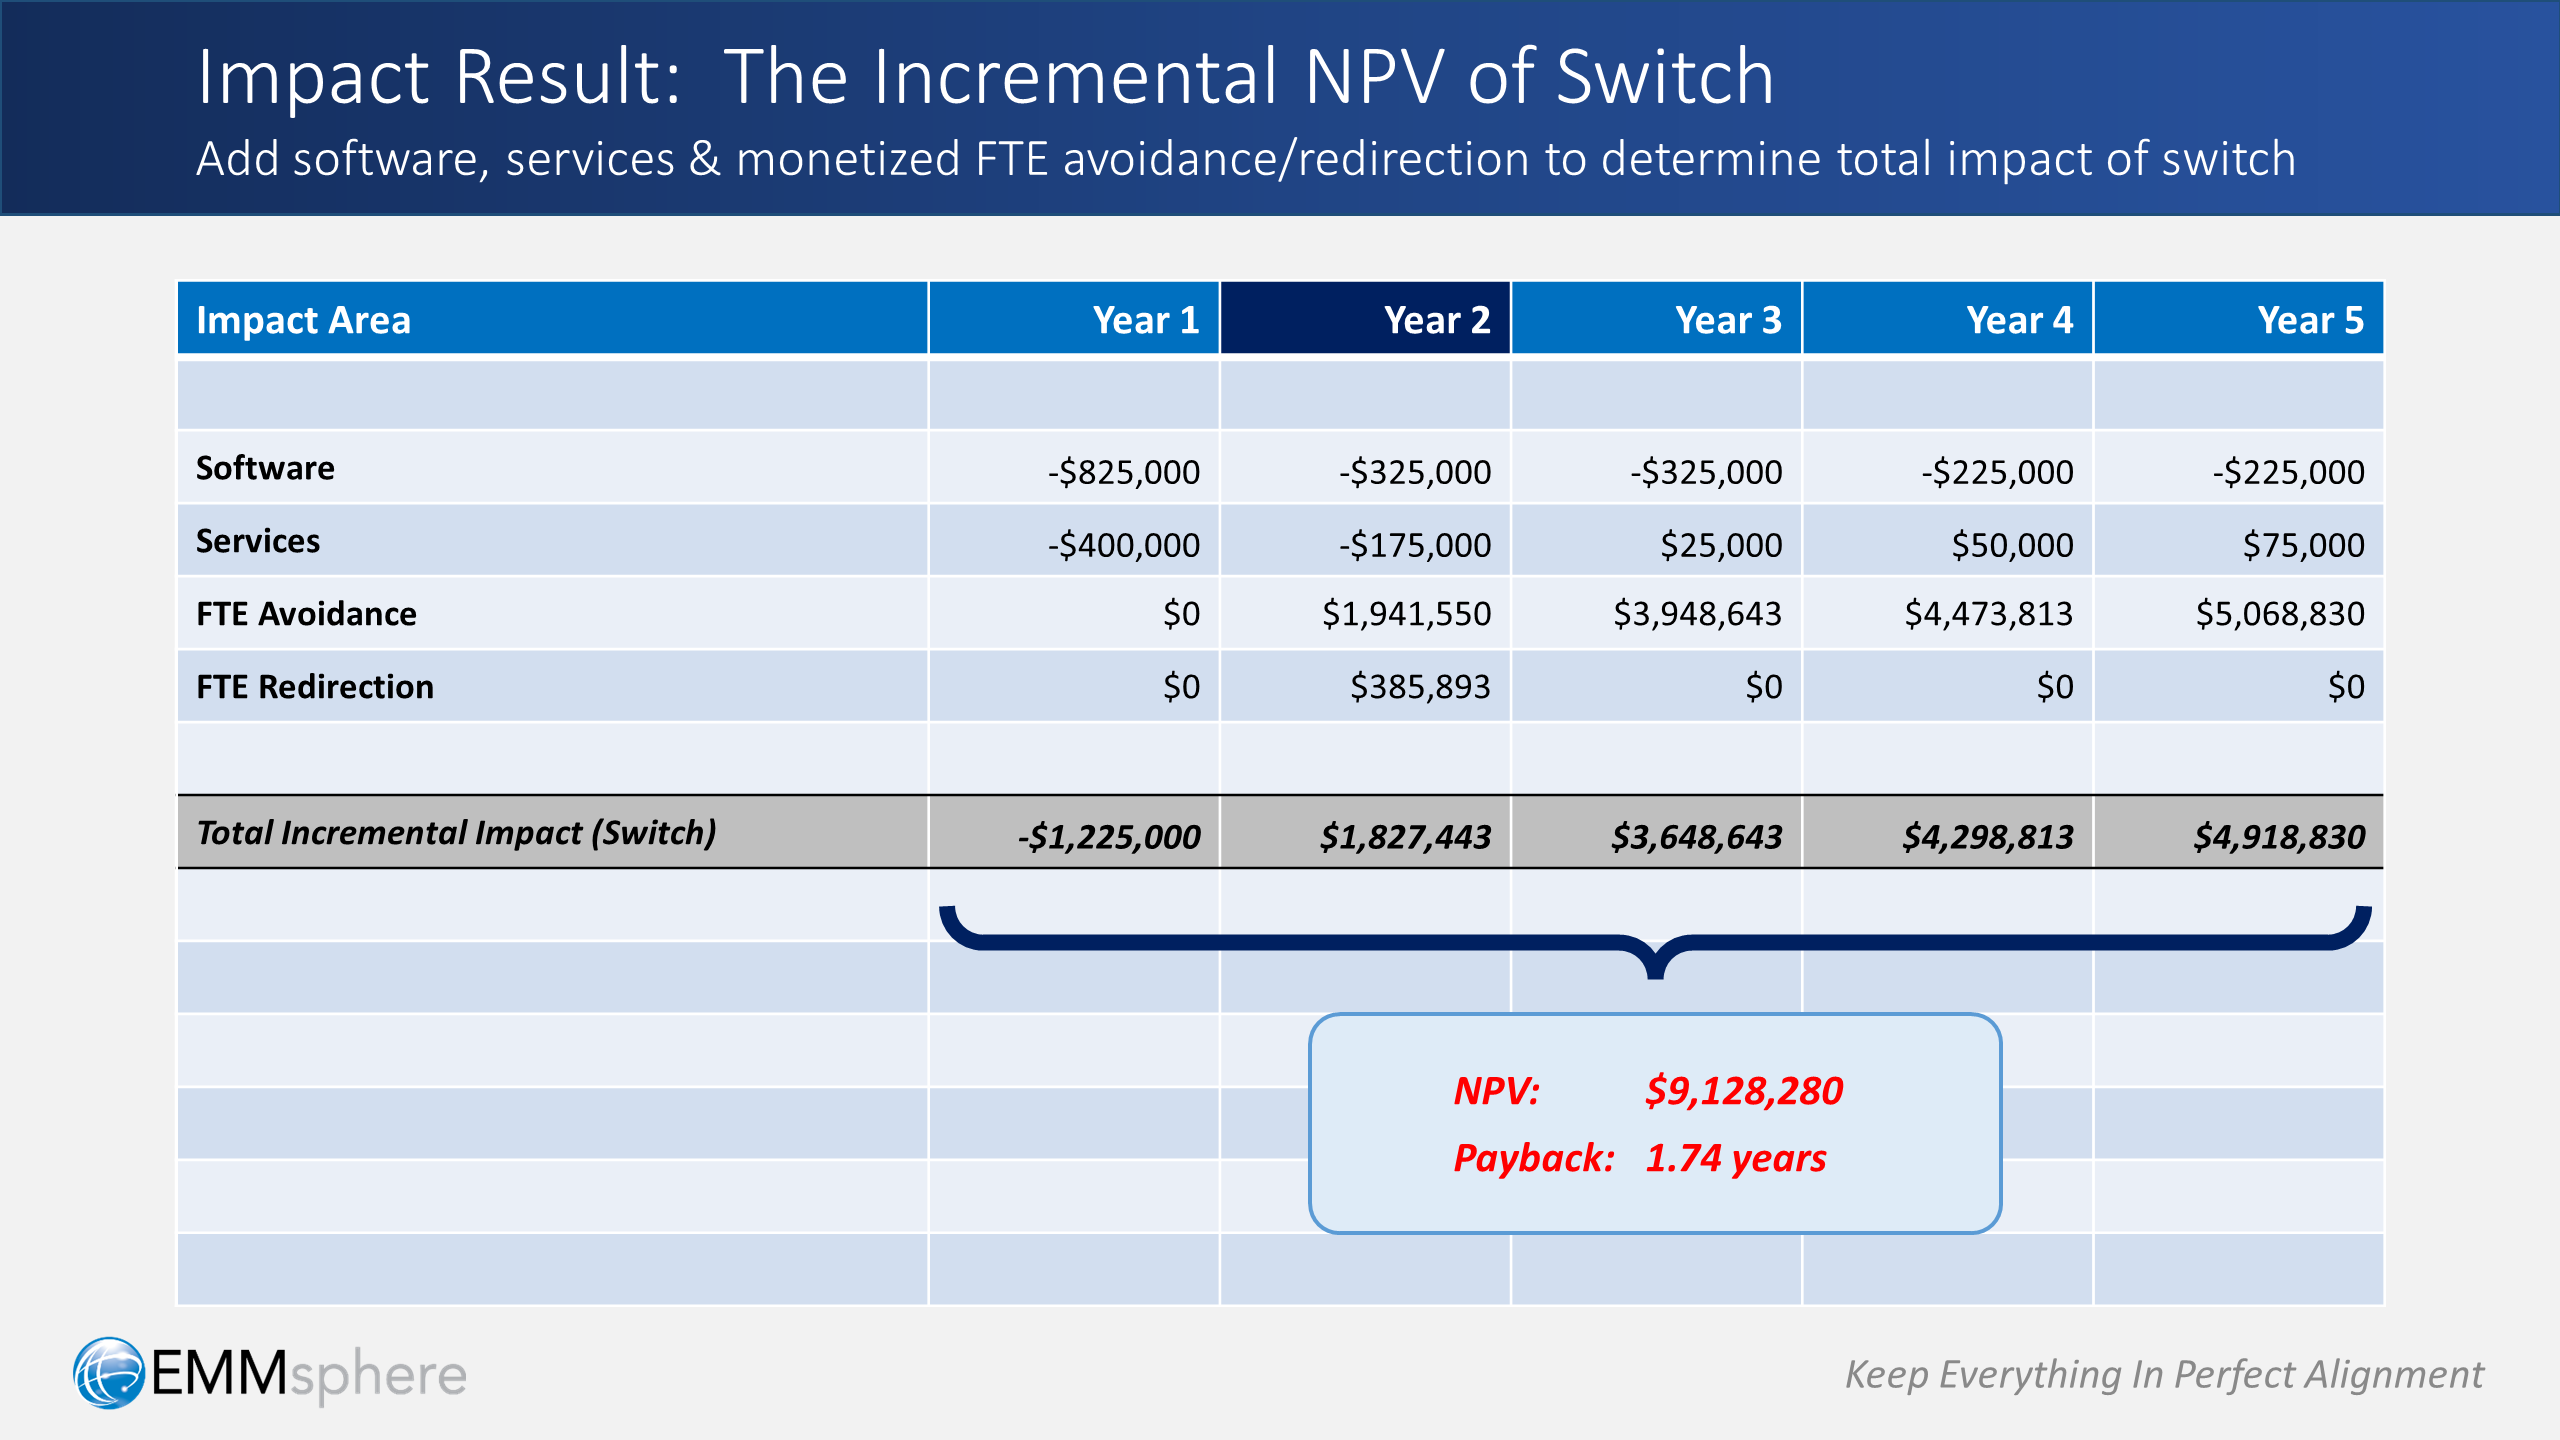
Now let’s put it all together:
- From Step 2, we have our software impact
- From Step 3, we include our services impact
- From all of our productivity analysis we have FTE avoidance, which we can monetize by applying the compensation numbers against the FTEs we no longer need to hire
- We also have FTE redirections, which we can monetize by applying the gross margin input number against those FTEs that can be redirected to other activities
Adding it all up: we get the total incremental impact expected for each year.
Finally, we discount it all back using our cost of capital, which gives us exactly what we were eagerly trying to estimate all along:
- An expected incremental NPV of $9.1 million
- An expected payback of 1.74 years
Which, we think your CMO would agree, indicates a very strong and compelling impact from the switch!
Closing Thoughts
Cost justification is a critically important, yet sensitive topic.
When we developed our impact model, we wanted to incorporate concepts that would be directly attributable to the platform’s capabilities, as opposed to tangential or secondary benefits (e.g. less time spent in meetings, fewer emails sent, etc.)
The reason we took this approach is simple: causality.
We also wanted to find a way that was realistic and reasonable: the idea of a platform deployment leading to current resource reductions didn’t seem to mesh with what we saw happening at client organizations. Nor did that idea seem particularly morale-boosting (quite the opposite, actually).
We believe that avoiding future costs, as opposed to reducing current costs, is a much more realistic and reasonable way to approach the challenge than typical ROI calculators we typically saw out there.
In our experience, the approach embedded in our model satisfies on all of these fronts. Plus, the model offers one more pleasant side-effect: it helps to facilitate decision approval — which is always a nice thing!
Next Steps
We’ve hardly scratched the surface — so much goes into a carefully considered platform decision! Don’t worry, we’ve got you covered. And, as a next step, we invite you to check out some of our other posts:
- Platform Decisions: When & How to Build a Case
- Platform Decisions: Evaluating Fit
- Platform Decisions: Assessing Viability
- Platform Decisions: Estimating Impact
- Platform Decisions: Testing Assumptions
- Platform Decisions: Differentiators & Productivity Levers
- Platform Decisions: Thoughts About Change
- Platform Decisions: Getting All The Juice
Leave a Reply